In private credit, the character of your deal sourcing determines the destiny of your portfolio. How new transactions come in the door, and how you choose the best ones to close, drive your performance. Nothing else matters.
As we’ve learned in this series, private credit developed from the core middle market (CMM) (see Chart of the Week). This set the principles that became popular with issuers and investors alike: loans to small-to-medium-sized enterprises (SMEs) in diverse, defensive sectors backed by private equity sponsors with conservative terms and structures...
Quote of the Week
“Credit continues to fulfill its strategic objectives of income generation, diversification, and moderate risk while remaining within guidelines.” – Jonathan Grabel, chief investment officer, Los Angeles County Employees Retirement Association (Reuters).
Featuring Charts

Chart of the Week: Ex Uno, Plures
Unlike the US, private credit began as one entity and morphed into many states. Source: Apollo Outlook For Public and Private Markets (April 2026)
Read More
Chart of the Week: Different Strokes
Core and LMM portfolio overlap has remained relatively stable over the past decade. Source: Company filings and Raymond James research
Read More
Chart of the Week: Leverage Takeover
Middle market buyout financings increasingly dominated by direct lenders. Source: LSEG LPC. Middle Market LBO volume.
Read More
Chart of the Week: Perception is Reality
Investors bombarded with scary headlines worrying less about real private credit risks. Source: PitchBook
Read More
Chart of the Week: The IT Factor
IT deals commanded a larger piece of the M&A pie in 2025. Source: PitchBook
Read More
Chart of the Week: Leading the Way
The US was a relative bright spot in global private equity fundraising in 2025. Source: Preqin, McKinsey analysis
Read More


Subscribe Now!
Join the leading voice of the middle market. Try us free for 30 days.
Click here to view the Newsletter sample.
What is the Lead Left?

- One-stop source for deals and data
- Market trend commentary and analysis
- Exclusive interviews with thought leaders

View Article By
Features
Middle Market & Private Credit – 4/20/2026

US Software Credit Opinions Vulnerable to EBITDA Stress; US MM CLOs Resilient Click here to learn more. Software Issuers in Credit Opinion Portfolio More Vulnerable to EBITDA Stress Technology software issuers in Fitch’s model-based credit opinion (MCO) portfolio were more vulnerable to credit deterioration under a severe earnings stress than issuers in the portfolio excluding…
The Pulse of Private Equity – 4/20/2026

PE take-private deal activity Download PitchBook’s Report here. PE take-private activity was robust in Q1 2026, as value rose to $64.3 billion, up 13.0% QoQ and 53.3% YoY, even as deal count fell to 13 from 14 last quarter…. Subscribe to Read MoreAlready a member? Log in here...
Bloomberg: Leveraged Lending Insights – 4/20/2026

Loan Funds See Inflows Following Steady Stream of Redemptions Click here to access Bloomberg’s latest Global Leveraged Loan Index Report Retail investors have returned to loan funds following two months of net redemptions. The Invesco Senior Loan ETF (BKLN) recorded $265m in inflows this month through April 21, a reversal from the $125m in outflows…
PDI Picks – 4/20/2026

Secondaries on the rise – but views of it differ Alignment is something not everyone can agree on, but there’s little doubt this is a market with strong momentum. Secondaries transaction and fundraising figures moved in one direction last year – up – but when it comes to market sentiment, the direction of travel is…
Octus: Private Credit & Deal Origination Insights – 4/13/2026

BDC Holders by Portfolio Company Octus analyzed 27 stressed securities across 23 borrowers and found that fair value pricing varied by as much as 40 points between the lowest and highest marks… Subscribe to Read MoreAlready a member? Log in here...
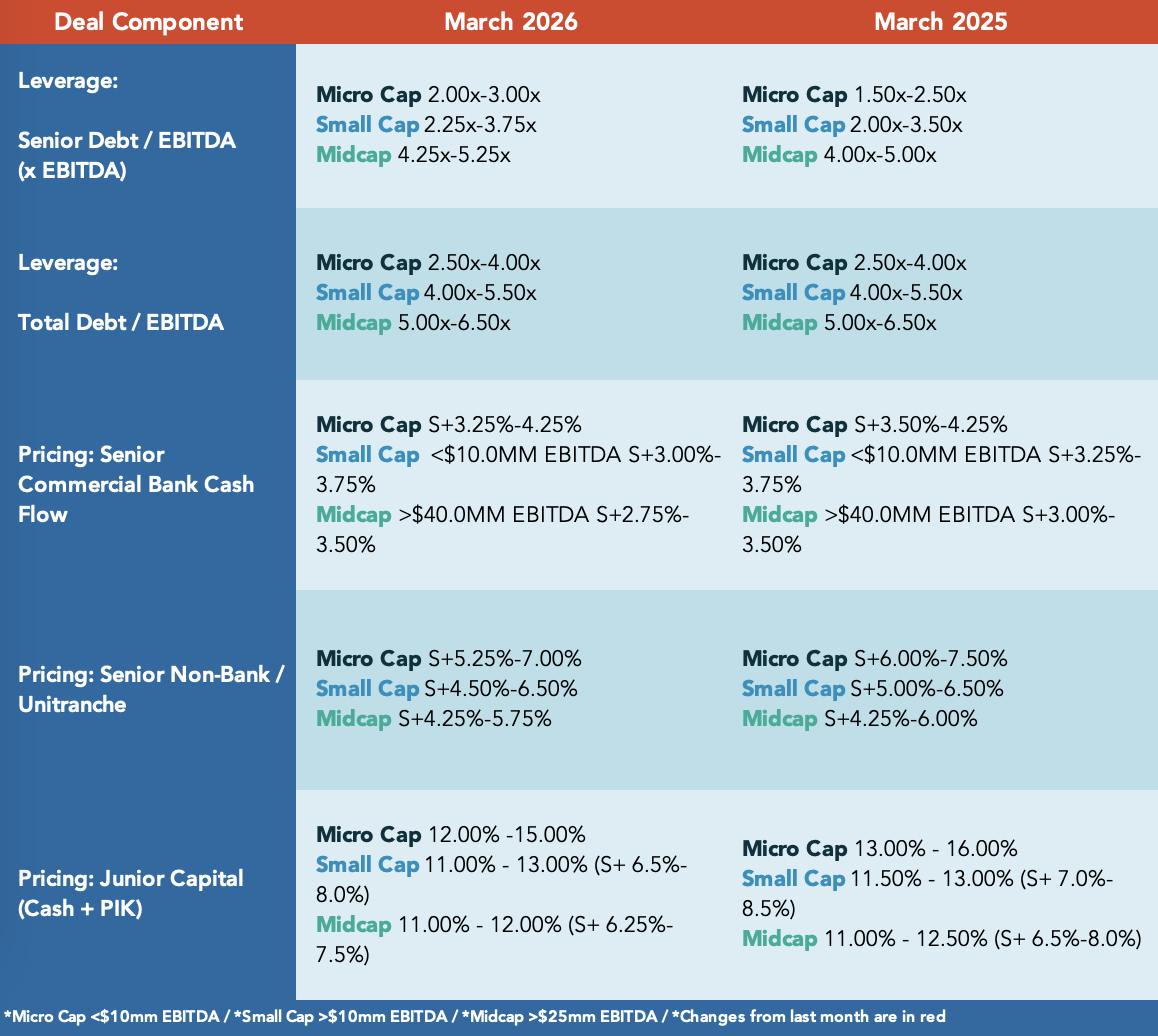
Middle Market Deal Terms at a Glance
provided by
![]()

Beginning in July 2022 The Lead Left published a series of articles on credit market. This report consolidates those articles.

Cov-lite trends Inflation & rising interest rates – LIBOR to SOFR transition Mega-tranche uni trend ESG takes center stage Login to view interactive report and download PDF version. … Subscribe to Read MoreAlready a member? Log in here Related posts: 2H 2021 Midyear Outlook Report State of the Capital Markets – Fourth Quarter 2016 Review and

Beginning in September 2021 The Lead Left published a series of articles on supply chain. This report consolidates those articles.
Our Content Partners