Chart of the Week: Cliff Notes
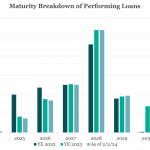
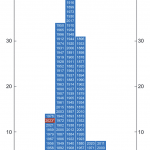
Less than 20% of institutional leveraged loans come due in the next three years. Source: PitchBook LCD, Morningstar LSTA US Leveraged Loan Index(Past performance is no guarantee of future results.)
Less than 20% of institutional leveraged loans come due in the next three years. Source: PitchBook LCD, Morningstar LSTA US Leveraged Loan Index(Past performance is no guarantee of future results.)
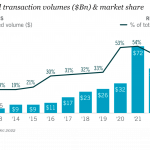
The share of GP-led equity secondaries has peaked relative to LP-leds. Source: Jefferies(Past performance is no guarantee of future results.)
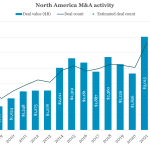
With higher rates creating financing and valuation challenges, M&A has plummeted. Source: PitchBook(Past performance is no guarantee of future results.)
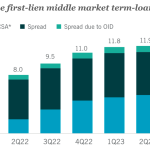
Investors benefit from – and issuers work through – higher-for-longer rates. Source: LSEG LPC(Past performance is no guarantee of future results.)
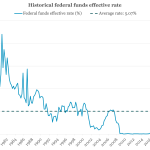
US interest rates have returned to their average levels of the past half century. Source: Board of Governors of the Federal Reserve System(Past performance is no guarantee of future results.)
The past two years have not been kind to holders of ten-year Treasurys. Source: The Daily Shot, Alpine Macro(Past performance is no guarantee of future results.)
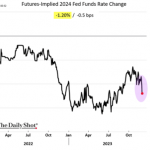
The futures market now expects Fed Funds to be 120 bps lower next year. Source: The Daily Shot(Past performance is no guarantee of future results.)
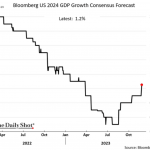
Economic growth estimates for next year have improved in recent months. Source: Bloomberg, The Daily Shot(Past performance is no guarantee of future results.)
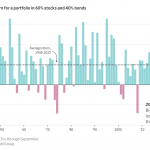
The traditional equities and fixed-income model is under-performing the historic average. Source: Bloomberg, The Daily Shot(Past performance is no guarantee of future results.)
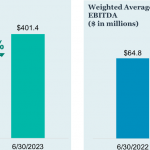
Churchill’s senior debt portfolio showing higher revenues and cash flows. Source: Churchill Asset Management LLC(Past performance is no guarantee of future results.)