Chart of the Week: Higher Ground
Monthly loan activity related to middle market buyouts has risen above the five year average for the first time in a year. Source: Thomson Reuters LPC
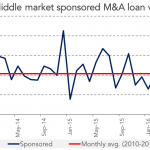
Monthly loan activity related to middle market buyouts has risen above the five year average for the first time in a year. Source: Thomson Reuters LPC
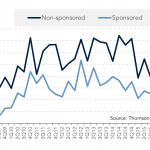
Loan volume for both sponsored and non-sponsored middle market transactions have generally slumped since 2014. Source: Thomson Reuters LPC
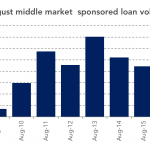
While last month’s loan volume seemed exceptionally slow, it was actually better than 2015’s level, and consistent with the past five years. Source: Thomson Reuters LPC
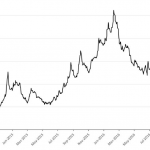
Junk bond spreads have eased this year in the face of continued Fed liquidity and a benign default outlook. Source: Bloomberg LP, The Daily Shot; high yield option adjusted spreads (all sectors)
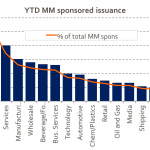
More new middle market sponsored deals have been in healthcare this year than any other sector. Source: Thomson Reuters LPC
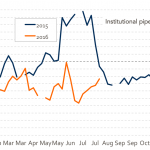
The pipeline for large corporate institutional deals may finally catch up to last year’s levels, after being behind almost all year. Source: Thomson Reuters LPC
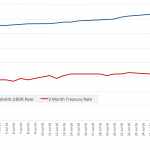
With the Fed more likely to push rates in September, Libor rose more quickly last month than comparable Treasuries. Sources: U.S. Department of the Treasury/FRED
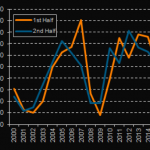
Middle market sponsored volume for the first six months of 2016 was the lightest in seven years. Source: Thomson Reuters LPC
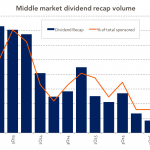
Thanks to continued concern about market volatility, dividend recap activity in the middle market has slowed to a crawl in the second quarter. Source: Thomson Reuters LPC
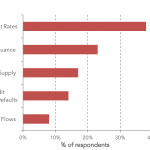
Attendees at last week’s Fitch/LPC Loan and CLO Conference said Fed’s rate inaction was most surprising market news so far this year. Source: Fitch Ratings and Thomson Reuters LPC Loan and CLO Conference