Refinitiv LPC

Leveraged Loan Insight & Analysis - 2/6/2017

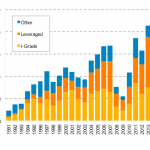
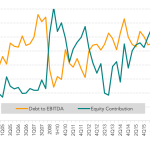
Overall LBO leverage on the rise in 1Q17

Average leverage levels on both large corporate and institutional middle market LBO deals have shown a meaningful jump in 1Q17. With refinancings and repricings dominating the leveraged loan market, investors seem more willing to stretch on new money LBO deals. The average leverage level so far in 1Q17 is at 5.0 times first lien and 6.50 times total debt to EBITDA, up from 4.6 times senior by 6.1 times total last quarter...

Leveraged Loan Insight & Analysis -1/30/2017

Strong retail fund inflows help fuel the leveraged loan market

Investors have been pouring money into retail loan funds in recent months. This has helped fuel demand in the leveraged loan market. Last week, investors placed US$1.02bn into retail loan funds, the second time in three weeks the US$1bn mark was eclipsed. It was also the tenth week out of the last eleven that there was over US$500m invested in loan funds. With the increased demand in loans, it is no surprise the leveraged loan market has kept busy...

Leveraged Loan Insight & Analysis -1/23/2017

Unitranche volume grows while deal sizes get bigger

As money continues to pour into the middle market searching for yield, the unitranche structure continues to gain traction. Unitranche volume reached US$13.3bn in 2016, up from US$8.5bn in 2015. Bigger deals were seen in 2016 as more and more lenders continued to build scale and increase their hold size. The average deal size was $198M in 3Q16 and $129M in 4Q16. But 50% of unitranches continue to be in the $0-$100M deal size area...

Leveraged Loan Insight & Analysis -1/16/2017

Non-sponsored MM new money picked up in 2016; refinancings dropped

Non-sponsored lending dropped to US$86bn in 2016 from US$93bn in 2015. In contrast with every other major market segment (overall, leveraged, investment-grade, institutional, middle market sponsored) which witnessed a quarter over quarter increase in volume in 4Q16, non-sponsored middle market lending of US$22bn, was down 7%. Refinancings, the main driver of volume since the credit crisis, were down 21% in 2016 to US$53bn. Most of the refinancings were done in previous years and there was not that much in the form of opportunistic refinancings as pricing has somewhat stabilized in this market...

Leveraged Loan Insight & Analysis -1/9/2017

2016 middle market syndicated loan issuance lowest since 2009

Middle market syndicated loan issuance only reached US$139bn in 2016, down 3% from 2015 levels and the lowest annual level tracked since 2009. Several factors drove the lower levels. The non-sponsored market was the biggest culprit as issuers had no incentive to hit the market to refinance as long term financings were locked in during previous years. Furthermore, slow growth and uncertainty surrounding the economy and macro events such as...

Leveraged Loan Insight & Analysis -1/2/2017

Just shy of US$2tr 2016 US syndicated loan volume is flat year over year

US arrangers pushed almost US$2 Tr through retail syndication in 2016, levels on par with 2015 totals but down modestly compared to the US$2.1tr raised in 2014. The year got off to a slow start as the market volatility that was observed in the oil and gas and commodities sectors in late 2015 carried over to the first quarter of 2016, dampening lender appetite and limiting the pipeline of deals...

Leveraged Loan Insight & Analysis -12/12/2016

2016 MM CLO volume hits highest level post credit crisis

While the upcoming risk retention rules have certainly slowed broadly syndicated CLO volume in 2016, the middle market has bucked the trend. Middle market CLO issuance has reached US$7.7bn so far in 2016, surpassing last year's $5.8bn and reaching the highest level since 2007. This is a pleasant surprise as most managers that took LPC's Middle Market Investor Survey at the beginning of the year were only expecting to see around US $4.5bn in issuance this year...

Leveraged Loan Insight & Analysis -12/5/2016

Flex factor highlights investor pushback in November

Flex activity in the U.S. institutional loan market favored investors in November. Thomson Reuters LPC's Flex Factor registered an average flex score of 1.5 last month, signifying a higher ratio of investor friendly changes made to deal terms. It was the first time it has been above one since February's average score of 3.5. In all, 19 deals flexed higher in November against 13 reverse flexes. It was the least amount of reverse flexes in a month since March...

Leveraged Loan Insight & Analysis -11/28/2016

U.S. CLO portfolio trade prices climb

U.S. CLO portfolio trade prices have climbed from their early 2016 levels. The weighted average purchase was 98.92 in September, with the average sale price at 97.31. For the October trades collected so far, the weighted average purchase price is at 99.24, while selling prices average 97.67. Selling prices were more dispersed than purchase prices in 3Q16, as a higher share of portfolio sales were in the sub-98 and par-plus categories. CLOs sold loans at higher prices in the third quarter, with 50% of sales in the par-plus category, up from 37% in 2Q16...

Leveraged Loan Insight & Analysis -11/21/2016

Primary yields widen slightly so far in November

Yields have widened slightly in November to the highest average since July. The average yield, assuming a three year term to repayment on first-lien institutional loans is in the 5.36% context so far in November, slightly up from 5.1% in October. Demand for loans remains strong, and some issuers continue to successfully tap the market to cut costs, but weaker credits are facing some pushback. In turn, the number of downward and upward price flexes are roughly the same so far this month. In contrast, downward price flexes outnumbered upward price revisions by 2.3 times in October...