Understanding the connection between business and structural risks is one of the keys to successful credit investing. “Good company, bad balance sheet” is how opportunistic credit managers describe troubled but attractive situations in which to invest. It’s helpful to examine these transactions for clues as to how the borrower got a bad balance sheet to begin with.
Determining the appropriate amount of debt or leverage to put on the company is a good place to start. This is based on a number of factors, some obvious, some less so. How much cash flow will the business throw off under a variety of stressed “hypos”? Can it afford to pay interest and principal in a downside scenario? Underwriters often look at portfolio companies in similar sectors for insights into new transactions.
Sponsors always have a plan to grow their businesses. Is that plan fully supported by whatever financing structure (e.g. delayed draw term loan) is being proposed?...
“It feels like we’ve had an easy run up but the landscape is turning more challenging.” – Mark Dowding, chief investment officer, RBC BlueBay Asset Management
Featuring Charts

Chart of the Week: Rate Expectations
Loan participants see higher defaults from 1.6% today, but not much higher. Source: PitchBook/LCD(Past performance is no guarantee of future results.)
Read More
Chart of the Week: No Ifs, Ands, or Cuts
Market observers now think a rate cut at the Fed’s June meeting is unlikely. Source: The Daily Shot(Past performance is no guarantee of future results.)
Read More
Chart of the Week: Honey, I Shrunk the Interest Coverage Cushions
The Fed’s “higher-for-longer” has compressed leverage loan coverage ratios. Source: PitchBook | LCD(Past performance is no guarantee of future results.)
Read More
Chart of the Week: All About Portfolios
Top three criteria investors use to select credit managers are portfolio-centric. Source: Coalition Greenwich 2023 Private Credit Market Structure Study(Past performance is no guarantee of future results.)
Read More
Chart of the Week: Stepping Down
Private borrower covenant (not payment) default rates fell for third straight quarter. Source: Lincoln International Proprietary Private Market Database(Past performance is no guarantee of future results.)
Read More
Chart of the Week: Refi Madness
The reversal of refinancings between direct lenders and the liquid market is dramatic. Source: PitchBook LCD(Past performance is no guarantee of future results.)
Read More


Subscribe Now!
Join the leading voice of the middle market. Try us free for 30 days.
Click here to view the Newsletter sample.
What is the Lead Left?

- One-stop source for deals and data
- Market trend commentary and analysis
- Exclusive interviews with thought leaders

View Article By
Features
Private Debt Intelligence – 4/22/2024

The relative attractiveness of alternative asset classes has shifted significantly over the past few years as interest rates have risen and the economy become much less certain…. Login to Read More...
View ArticleLeveraged Loan Insight & Analysis – 4/22/2024


US sponsored middle market direct lending volume fell by 10% in 1Q24 Overall sponsored middle market loan volume fell by 6% to US$31.7bn in 1Q24, though it still represented a 46% gain year-over-year. Breaking out this activity, direct lending deal flow amounted to US$22.8bn in 1Q24 versus US$8.8bn of syndicated deals…. Login to Read More...
View ArticleMiddle Market & Private Credit – 4/22/2024


How Does the Default Outlook for the Middle Market Compare to BSL? Download FitchRating’s Report here. The default rate for loans in Fitch’s U.S. Leveraged Loan Universe was 3.3% at the end of 2023, in line with our forecast of 3.0%-3.5% and up from just 1.6% the previous year…. Login to Read More...
View ArticleKBRA Direct Lending Deals: News & Analysis – 4/22/2024

Refinancings redefine the direct lending market, claim 36% share in 1Q24 TTM Default Volume, Count Refinancings claimed 36% of 1Q24 direct lending volume in the US, the largest share of all proceeds, and the second-largest quarterly share for refinancings, behind the 41% in third quarter last year as tracked by KBRA DLD. Prior to 3Q23,…
View ArticlePDI Picks – 4/22/2024


LPs keen to address under-allocations The latest version of PDI’s Investor Report shows many investors have a long way to go to reach target exposures in private debt – but the intent is there. Private debt, along with other alternative asset classes, found last year to be a tough one on the fundraising trail –…
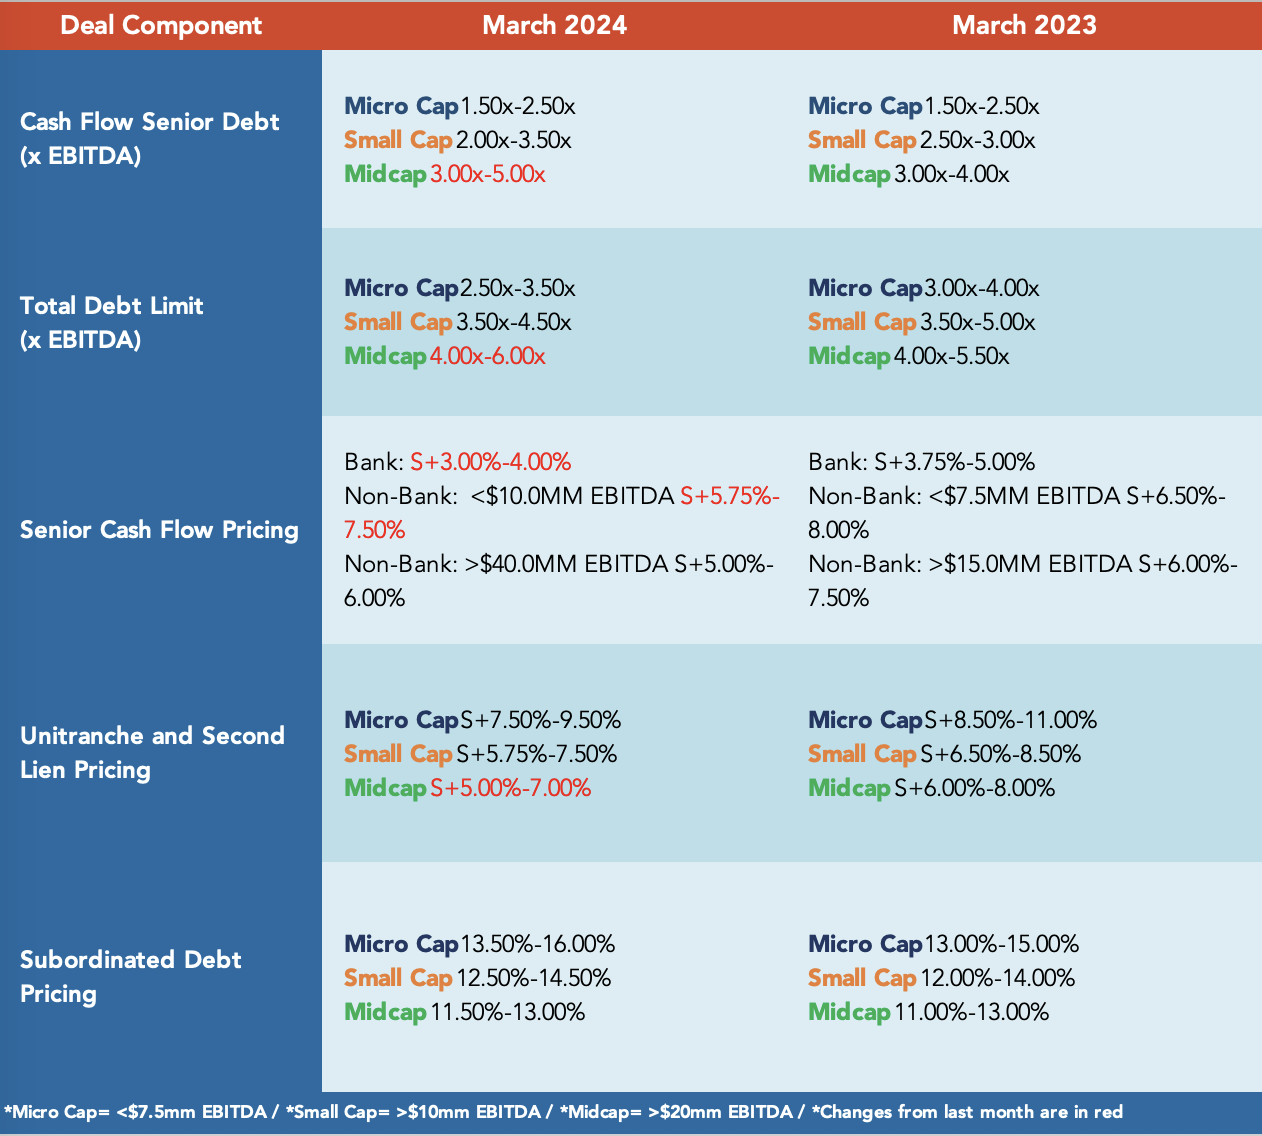
View ArticleMiddle Market Deal Terms at a Glance
provided by
![]()
Beginning in July 2022 The Lead Left published a series of articles on credit market. This report consolidates those articles.
Cov-lite trends Inflation & rising interest rates – LIBOR to SOFR transition Mega-tranche uni trend ESG takes center stage Login to view interactive report and download PDF version. … Login to Read More...
Beginning in September 2021 The Lead Left published a series of articles on supply chain. This report consolidates those articles.
Our Content Partners