


Non-sponsored middle market lending increased to US$102bn but new money collapsed

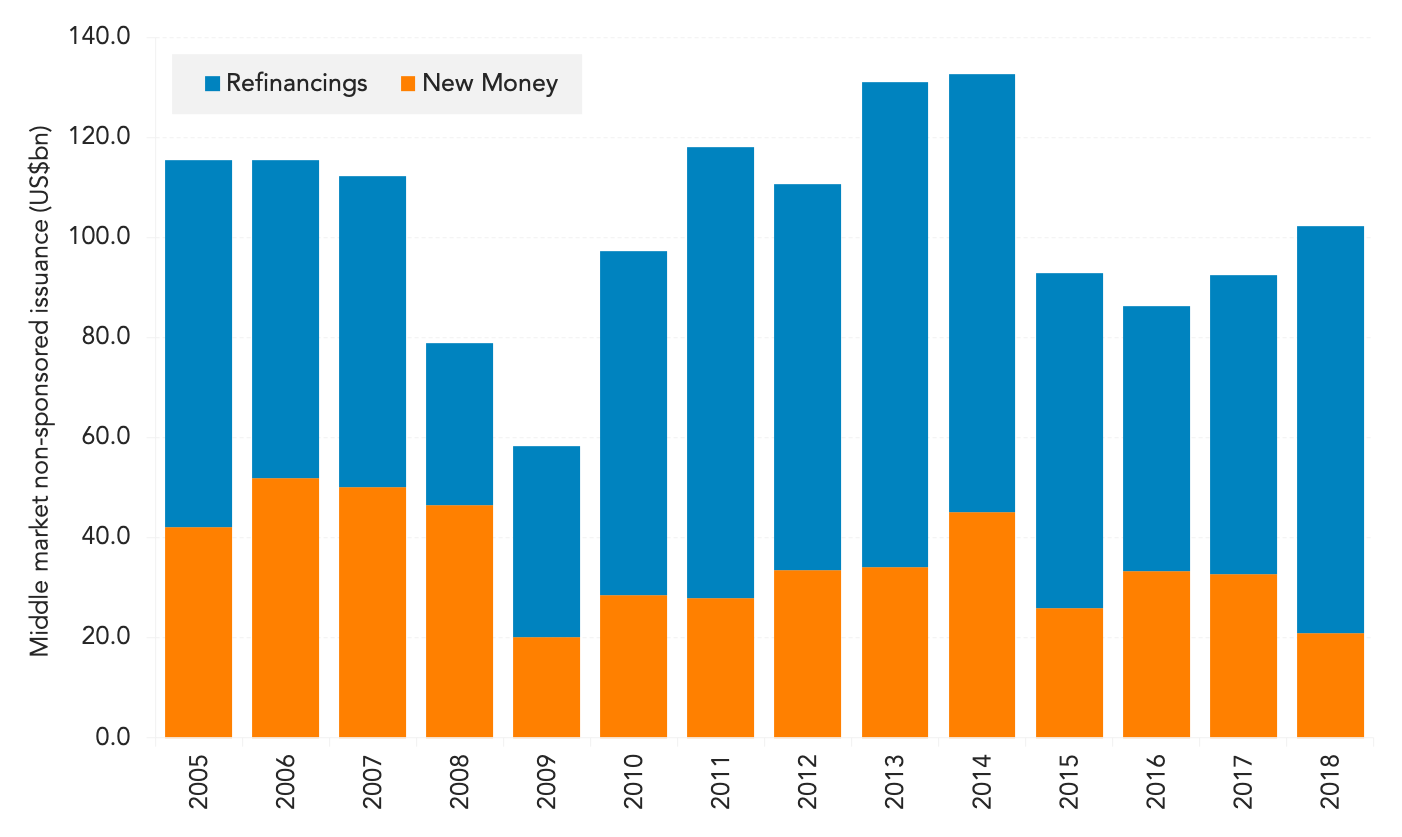
The non-sponsored market continued to tread along in 2018. Issuance was up for the second year in a row to US$102.3bn, but that was still far from 2014’s record and was driven by increased refi activity. Refinancing volume of US$81.3bn, was up 36% from 2017, recording its highest level since 2014. New money lending on the other hand was extremely disappointing at US$21bn, the lowest in 9 years. 2018 began with optimism as a business friendly administration and the new tax laws would certainly inspire issuers to finally pull the trigger on acquisitions and invest in future growth leading to increased lending. But this didn’t materialize. Non-sponsored M&A issuance declined each quarter of 2018 to a total of US$10.7bn for the year after reaching a post-crisis high of US$13bn in 2017. But while M&A declined, it drove more than half of total new money; its highest share in at least 13 years, as low capital expenditures was one of the main reasons behind lackluster new money lending. Looking ahead, some bankers are cautiously optmistic as they are seeing some M&A opportunities in the non-sponsored market and expect companies with loans coming due in 2020-2021 to tap for increased lines that will carry them through if there is a recession.
Contact: Diana Diquez
diana.diquez@thomsonreuters.com



Latest news

Top 50 BDCs Accounted for 75% of Nonaccrual Loan Cost in Q2’26
The 50 largest BDCs, on the basis of total debt investments as of the second quarter of 2026, accounted for 75% of the total aggregate reported value of nonaccrual debt at cost and fair value.

US private debt AUM ($B) by channel
In 2025 and the early part of 2026, the retail channel added AUM to the asset class at a much faster rate than institutional investors in both regions, with growth rates of 43.7% globally, 41.4% in the US, and 73. 1% in Europe through the beginning of 2026 compared with year-end 2024 figures.
