



Click here to access Bloomberg’s US Leveraged Finance Chartbook
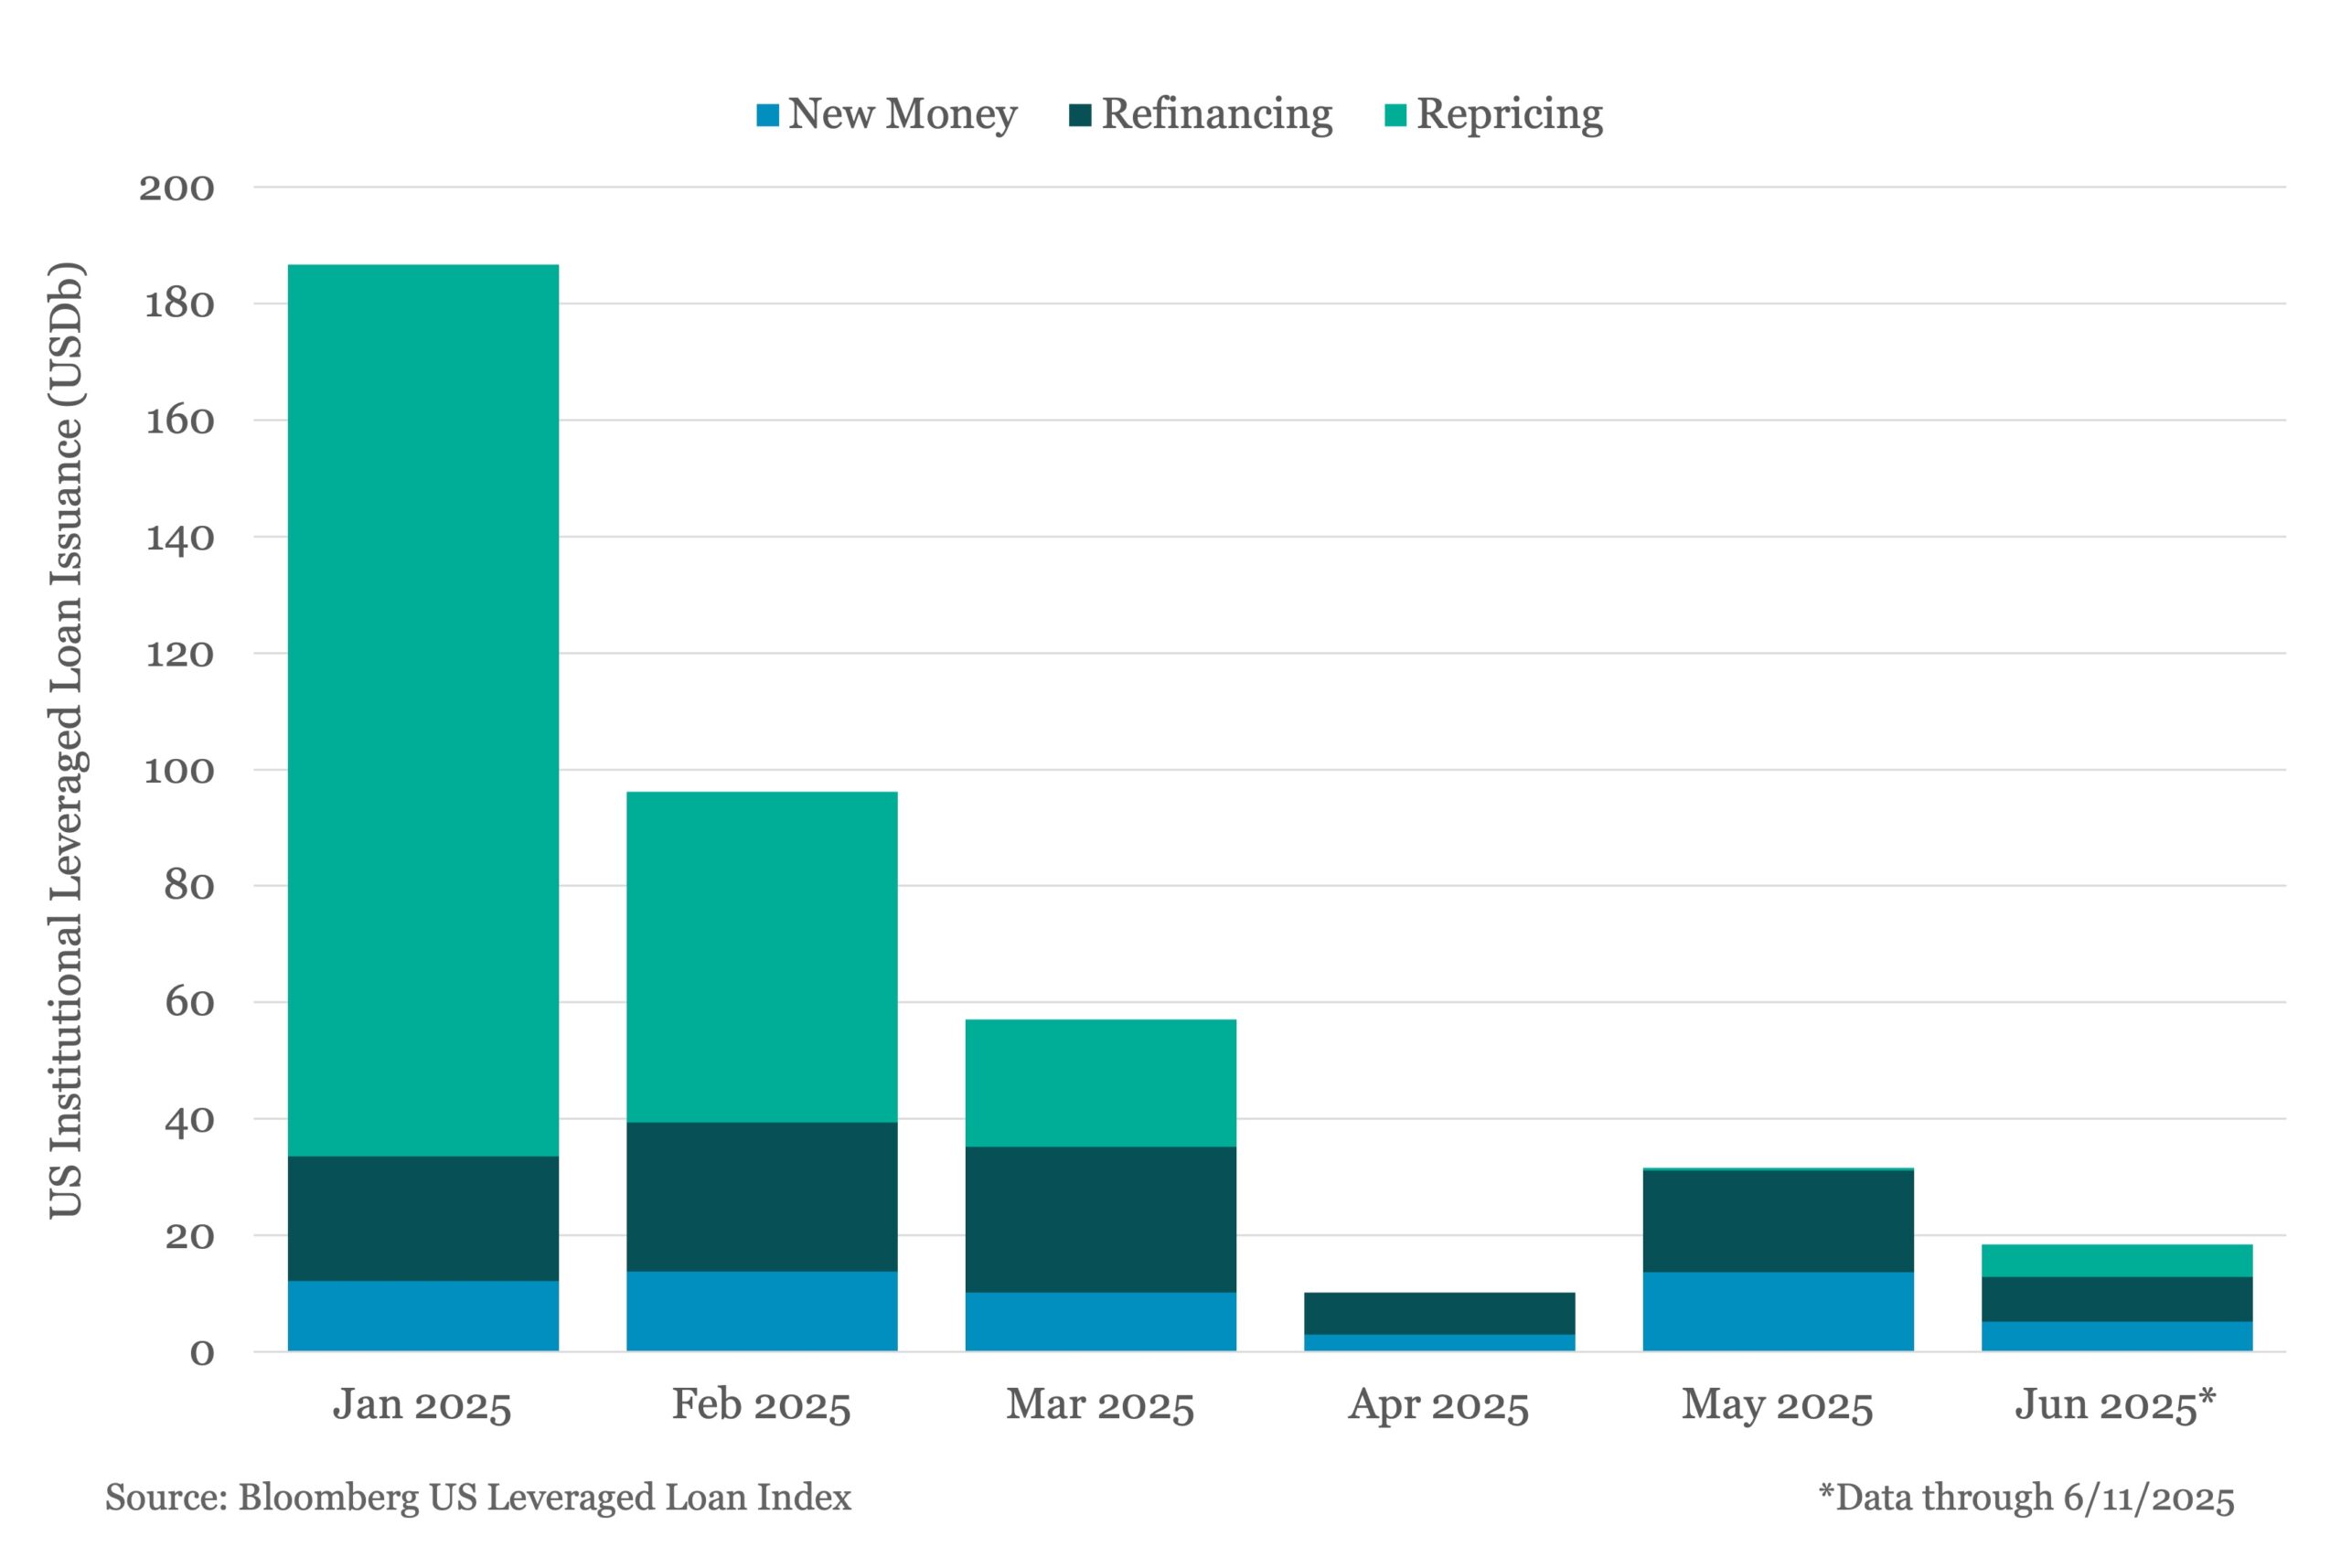
May’s 41 deals for $31.6b was up $21.4b, or 210% from April’s $10.2b, bringing year-to-date volume to $381b (down 31% from last year). In percentage terms, May’s rebound from April is the strongest since last September when issuance jumped over 252% off August’s low. However, despite that big percentage gain, May remains the second-lowest issuance month of the year in absolute dollars.
New money accounted for 43% of monthly issuance or $13.7b, with M&A making up 79% of the new money figure, or $10.8b. YTD M&A volume reached $39.9b, up 22% from the same time last year. An additional 18%, or $2.4b, was allocated towards dividend financings, bringing the YTD figure to $7.2b for a 35% improvement from last year.
So far in June issuance has continued to pick up, with $18.4b priced through June 11th and an additional $22.2b currently in syndication. Notably, after being largely absent from the market in April and May, repricings have returned, with $5.6b priced already this month.
Contacts:
Vincent Daigger
vdaigger@bloomberg.net
Lara Wieczezynski
wieczezynski@bloomberg.net




Latest news

US leveraged loans returns turn negative in October
The Bloomberg US Leveraged Loan Index (Ticker: LOAN) has returned -0.26% this month through October 21, reducing its year-to-date return…

M&A activity begins to tick upward
In the third quarter of 2026, acquisition-linked loan volume across North America and Europe reached about $47 billion, up from $30.6 billion in Q2 and $29.5 billion a year ago.
