



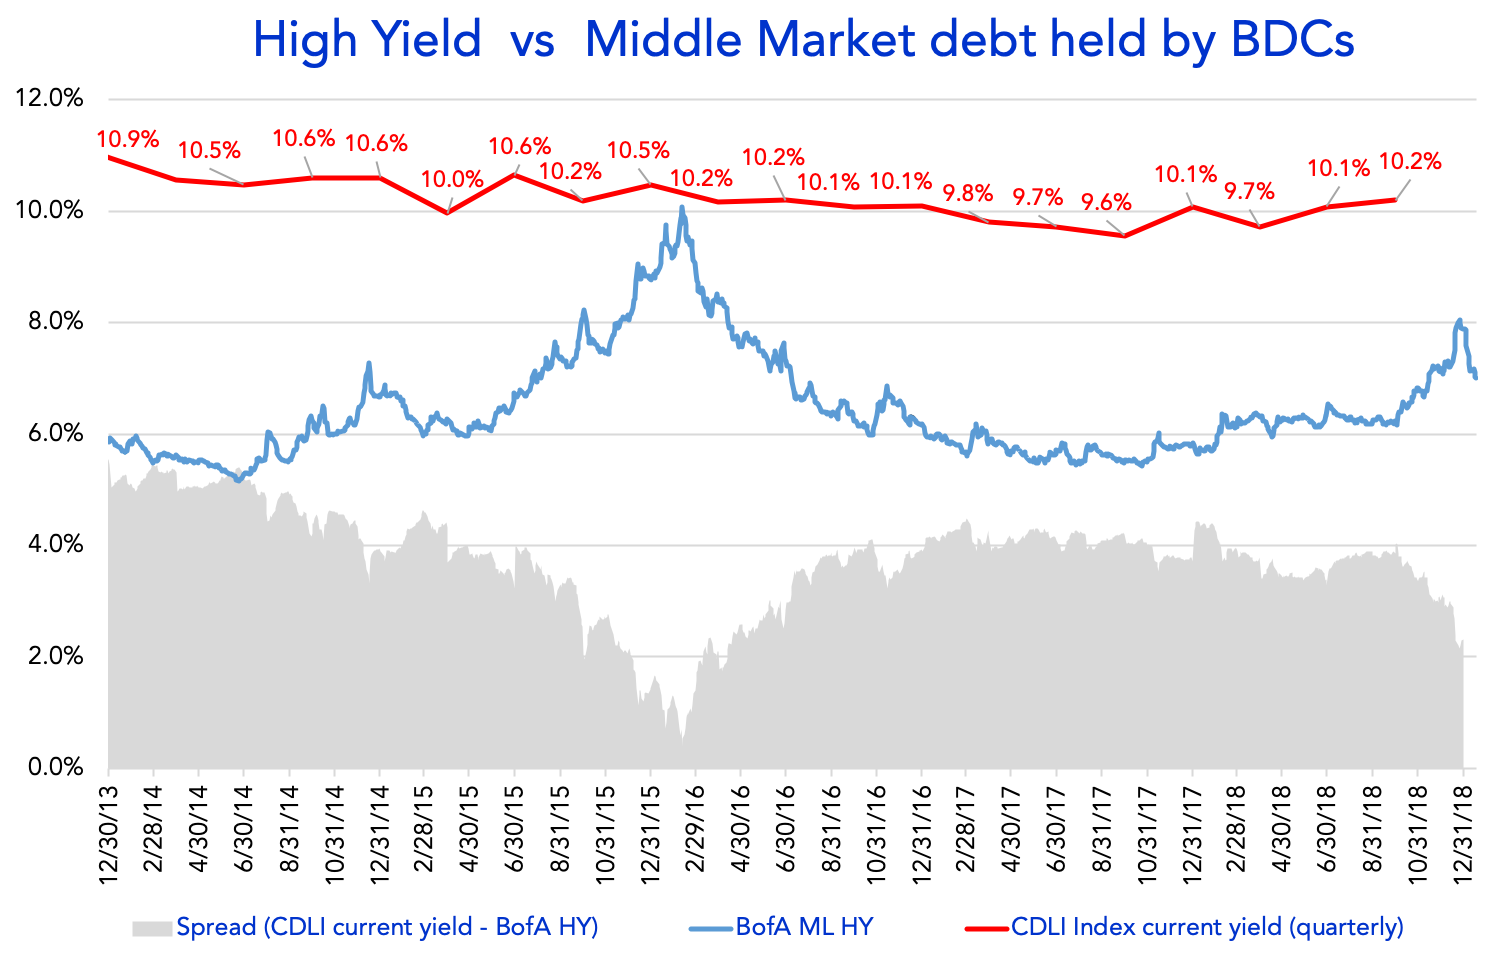
Source: Cliffwater Direct Lending Index and BofA Merrill Lynch US High Yield Effective Yield
The red line in the chart is the *Cliffwater Direct Lending Index (CDLI) current yield, which is based on the investment income of the underlying assets held by public and private BDCs. BDCs invest in middle market companies, and the Index comprises of more than 6000 middle market loans – with 61% senior debt, 26% subordinate debt and 8% equity. The blue line displays the BofA Merrill Lynch US High Yield, which tracks the performance of USD denominated below investment grade corporate debt publically issued in the US. Increase in high yield depicts dislocations in market, pricing in higher risk. The spread of CDLI current yield minus BofA ML HY (shaded area in grey) shows the premium of middle-market loans over traditional High Yield, gauging attractiveness of the asset class. The higher premium for middle-market, to some extent, depicts the illiquidity for private loans and credit risk associated with smaller companies. Following a steady surge in the spread in 2016, which stabilized in 2017 and 2018, but remains relatively attractive, with a 307-basis points differential, as of 17 January 2019.
* As of 30 September 2018, the CDLI index includes USD 97bn in assets, with more than 6000 loans – approximately 63% senior debt, 23% subordinate debt,9% equity and 5% other. BDC eligibility to be included in the Index is at least 75% of total assets represented by direct loans as of the Index valuation date. All the yields are unlevered. CDLI Index yield is total interest income of all BDCs covered, divided by their total assets, reported quarterly (9.34% as of 30 September 2018). CDLI data is quarterly while BofA Merrill Lynch HY Effective Yield is daily.
Contact:







Private Credit Defaults 101: Back to School
As Labor Day approaches, the unofficial end of summer is upon us. But, before we get too sad, there is also the familiar back-to-school energy.