



Source: Debtwire Par
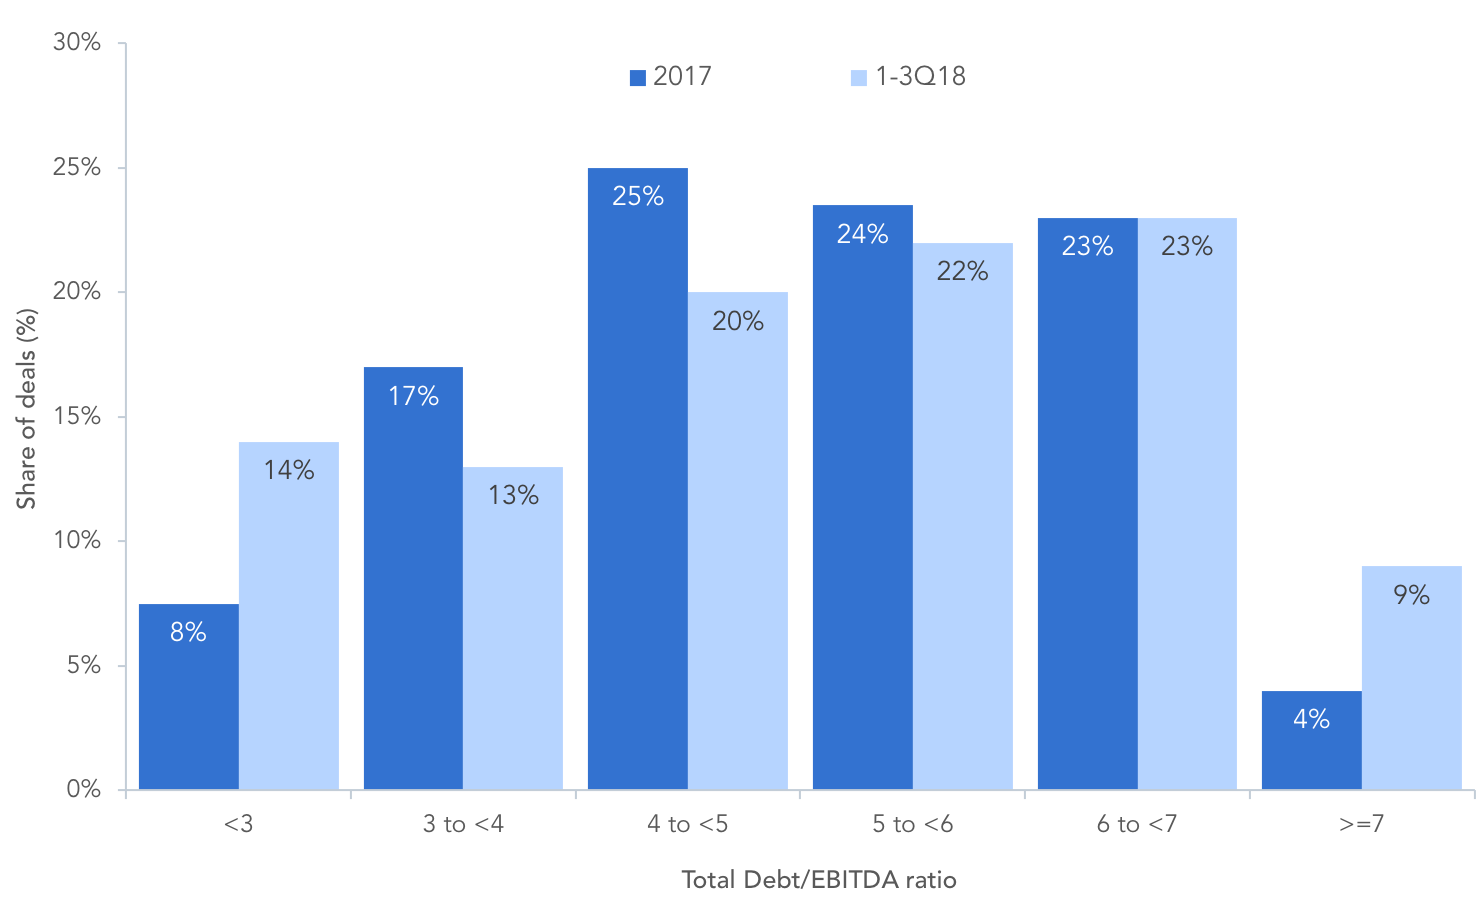
Leverage levels on new deals have drifted marginally higher this year, without a dramatic increase in any particular ratings category. Looking at marketed leverage levels, the share of highly levered transactions has trended upwards, with 32% of deals levered 6x or more, up from 27% last year. On the LBO side, the majority of deals (53%) in 2018 are levered 6x or more, up from 51% last year. Notably, the share of LBO deals levered 7x or more has climbed to 12%, up from 7% in 2017.
Buysiders suggest that we might see a further increase in leverage levels through year end and beyond, highlighting the need to clearly understand how EBITDA is calculated. According to one portfolio manager, “[Leverage levels will increase] because it’s been made more clear to banks that Leveraged Lending Guidelines are not going to be enforced, so they are getting comfortable underwriting more leveraged deals. But there hasn’t been a spike yet. It also depends on how you view EBITDA add-backs. Certainly advertised leverage is not up much but addbacks have gotten more aggressive and abundant.”
Contact: Colm (CJ) Doherty




Latest news


PE fund distribution rates
Following 2021, buyout distribution rates have fallen to roughly 10% to 15% below the 25-year average.

Sub line pricing flattens
A report on the topic also finds that investors are less concerned by leverage in NAV loans. Pricing for subscription…