



Source: Debtwire Par
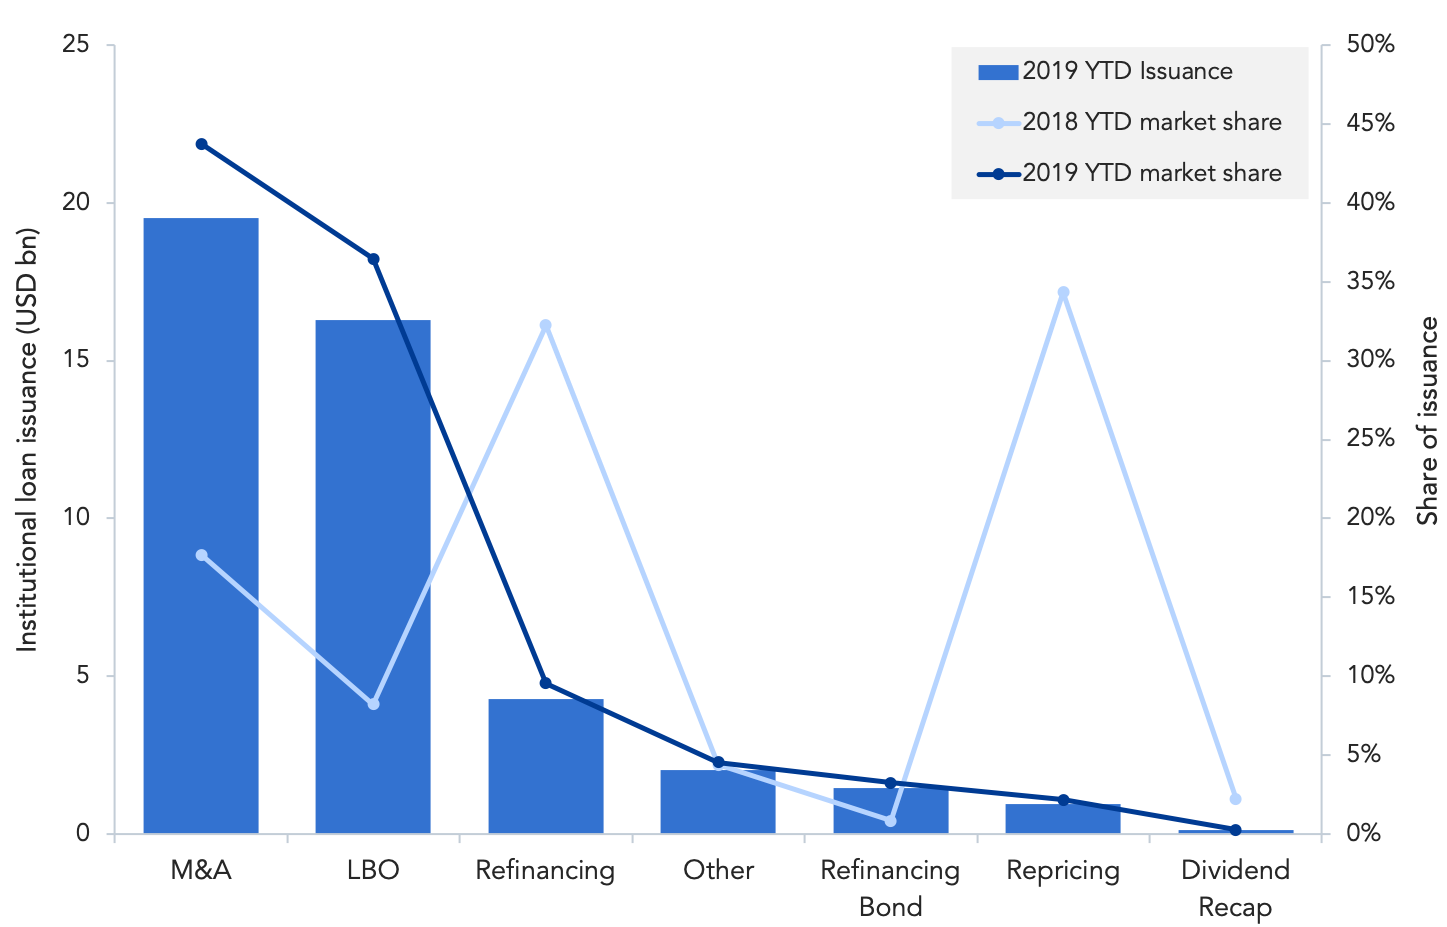
Despite leveraged loan issuance posting a sharp decline year-over-year (YoY), the good news for buysiders is that M&A and LBO activity is driving deal flow so far in 2019. Institutional loans backing M&A (excluding LBOs) is at USD 19.5bn year-to-date, with LBO loan volume amounting to USD 16.3bn. These two categories combined represent 80% of institutional loan issuance. Taking a closer look at issuance levels YoY, we see that LBO loan volume is up 84%, while M&A (excluding LBO) volume is up slightly by 2%.
The make-up of loan deal flow stands in sharp contrast to the same period last year, when repricing and refinancing activity was the main engine of issuance, accounting for 67% of volume combined. In comparison, these two categories represent a lowly 5% of deal flow this year, proving to be less attractive due to the widening in loan spreads, lower secondary market levels and the relatively weaker market technicals in the midst of outflows from retail loan funds.
Contact: Colm (CJ) Doherty



Latest news

US Leveraged Loans Return 3.36% to Investors YTD
The Bloomberg US Leveraged Loan Index (Ticker: LOAN) returned 0.96% in August and has gained an additional 0.28% through September…

PE dry powder
The capital that is being raised is flowing overwhelmingly to the largest, most established managers.

Middle market debt held by BDCs vs High yield vs Treasury yields
The blue line represents the current dividend yield of the VanEck BDC Income ETF (BIZD), which stood at 11.7% as…