



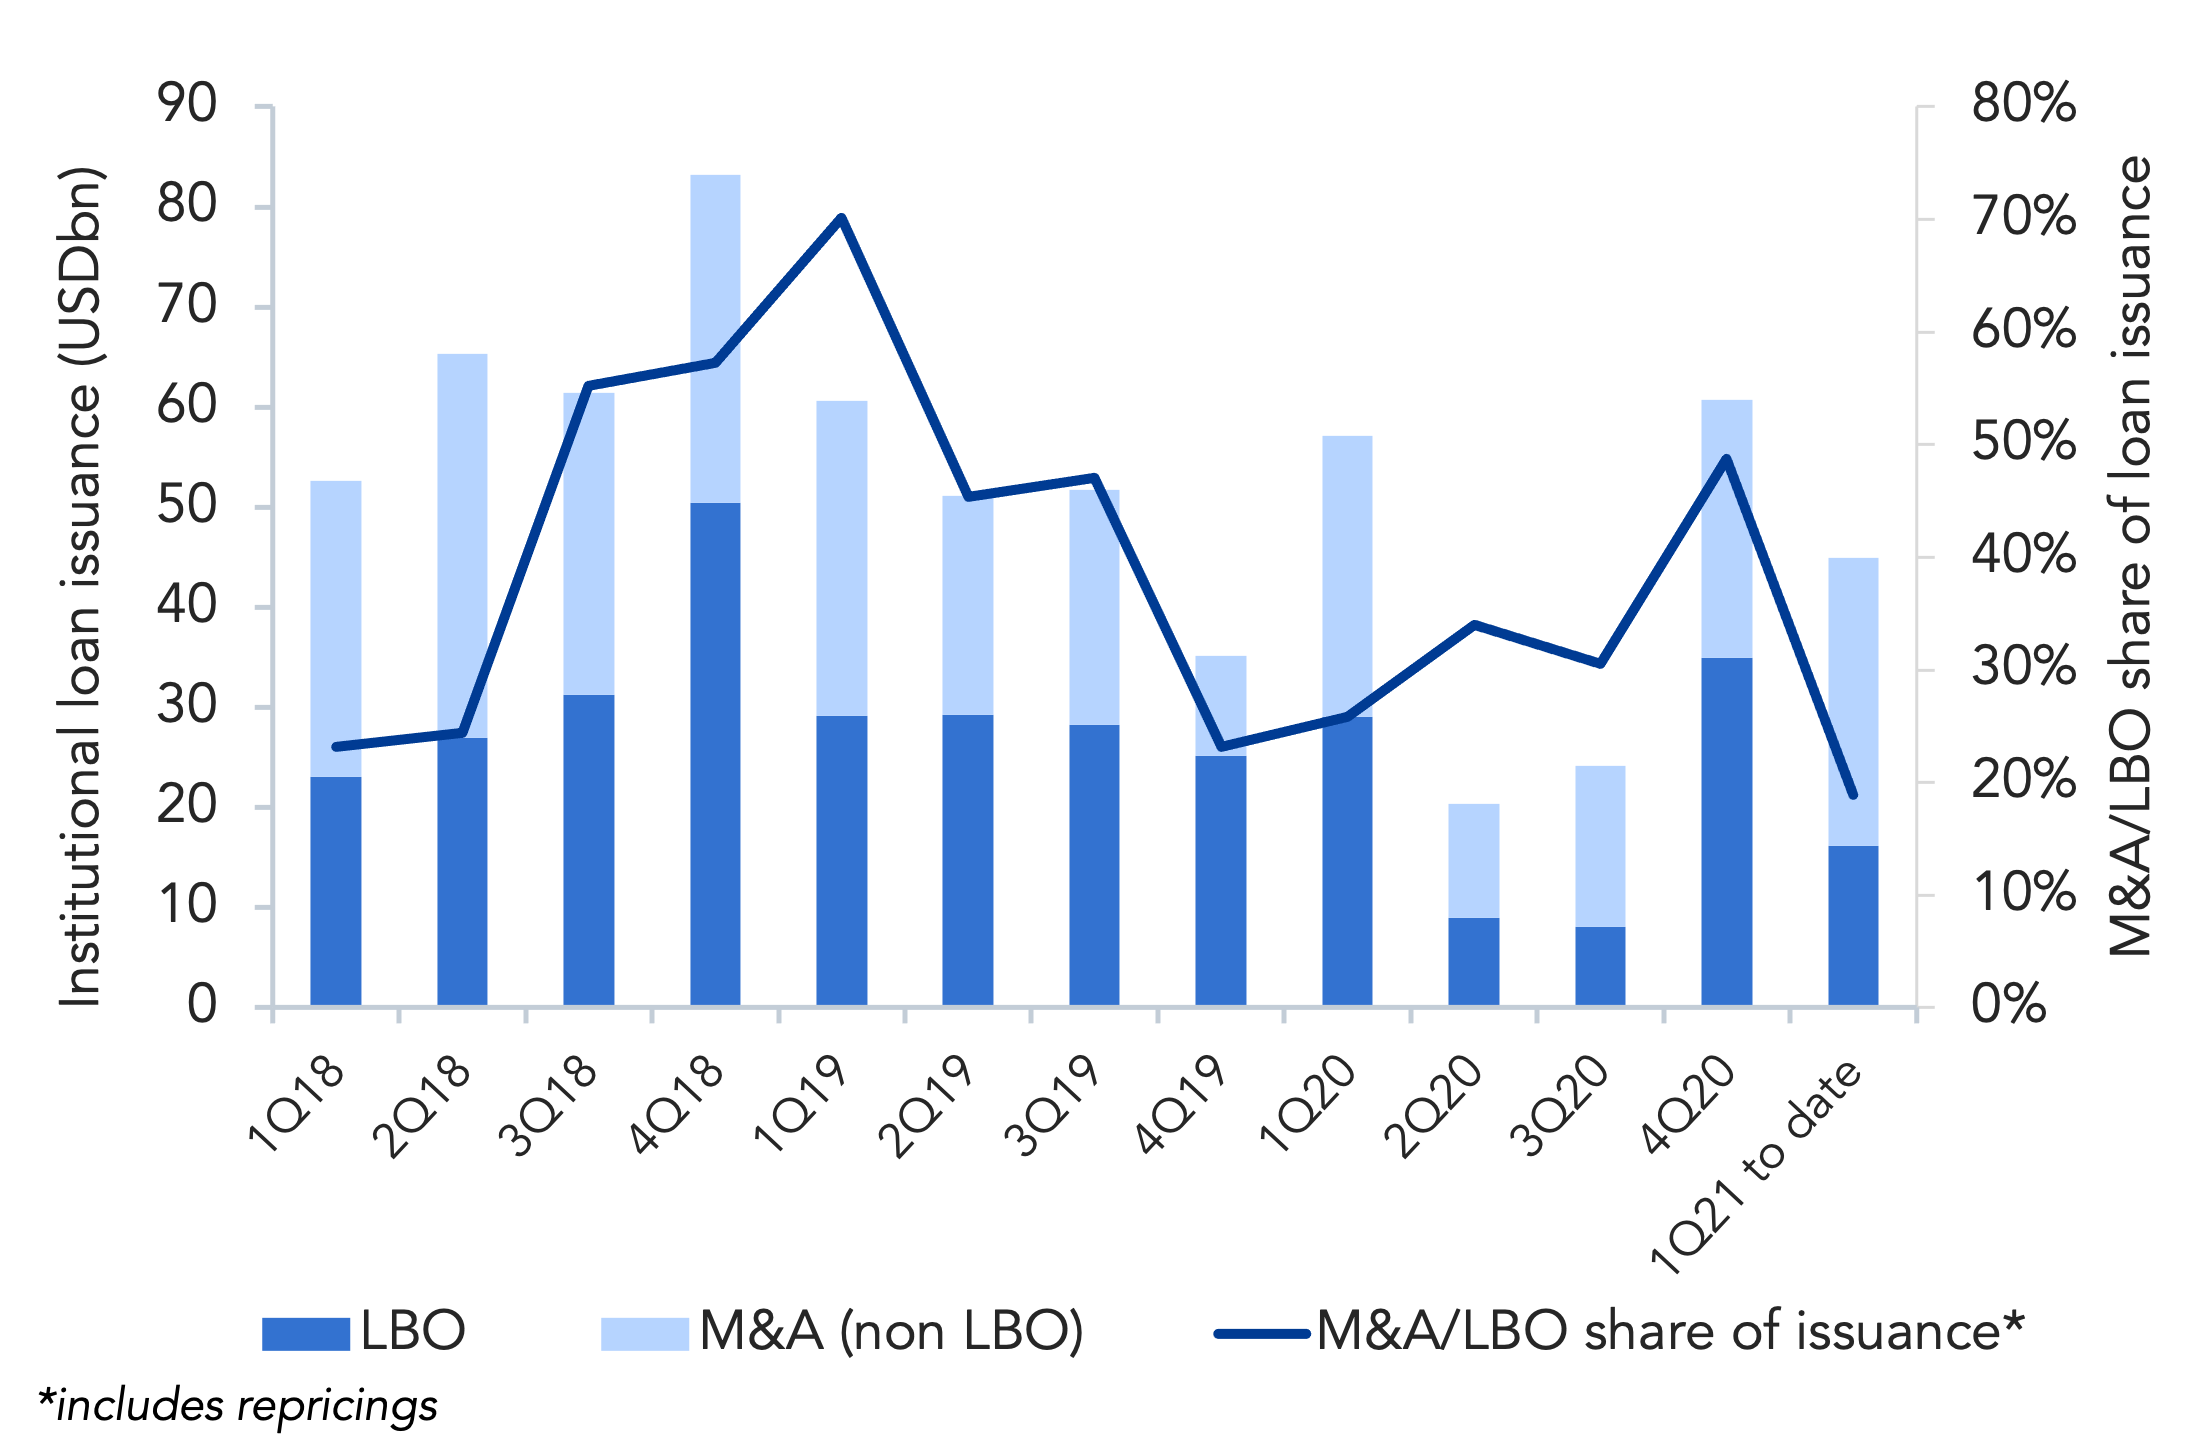
Source: Debtwire Par
It has been a busy start to the year in the leveraged loan market, though not when it comes to loans backing LBO activity.
New money loan transactions, and LBOs in particular, have struggled to keep up with demand from lenders, prompting a surge in institutional loan repricing activity to USD 107bn and refinancings to USD 72.5bn, as borrowers have capitalized on the supply-demand imbalance to opportunistically cut pricing on their loans and extend maturities.
Though LBO transactions have been present in the market, the level of deal flow is far below that seen last year, with syndicated institutional loan issuance backing LBOs down 42% year-over-year to USD 16.2bn. Further emphasizing the lower levels of new money deal flow is that the combined M&A/LBO share of overall loan issuance (including repricings) has slumped to 19% so far in 1Q21.
It is not that the sponsors lack cash, rather, loan portfolio managers point to several factors contributing to the challenging environment that private equity firms face. They range from elevated equity multiples, along with competition for target companies from strategics and SPACs.
Lenders are hoping that buyout activity picks up given the juicier loan pricing these deals often attract and the incremental debt they provide. More buyouts would help with the challenge portfolio managers face these days: keeping attractively priced assets in the portfolio.
The largest buyout deal recently was RealPage, which priced a USD 2.75bn first lien TLB at Libor+ 325bps (50bps floor) with a 99.75 OID. Proceeds will fund its acquisition by Thoma Bravo. As part of the financing package for the USD 10.2bn buyout, a USD 1bn second lien TL was privately placed.
(Past performance is no guarantee of future results.)




Latest news


PE fund distribution rates
Following 2021, buyout distribution rates have fallen to roughly 10% to 15% below the 25-year average.

Sub line pricing flattens
A report on the topic also finds that investors are less concerned by leverage in NAV loans. Pricing for subscription…