



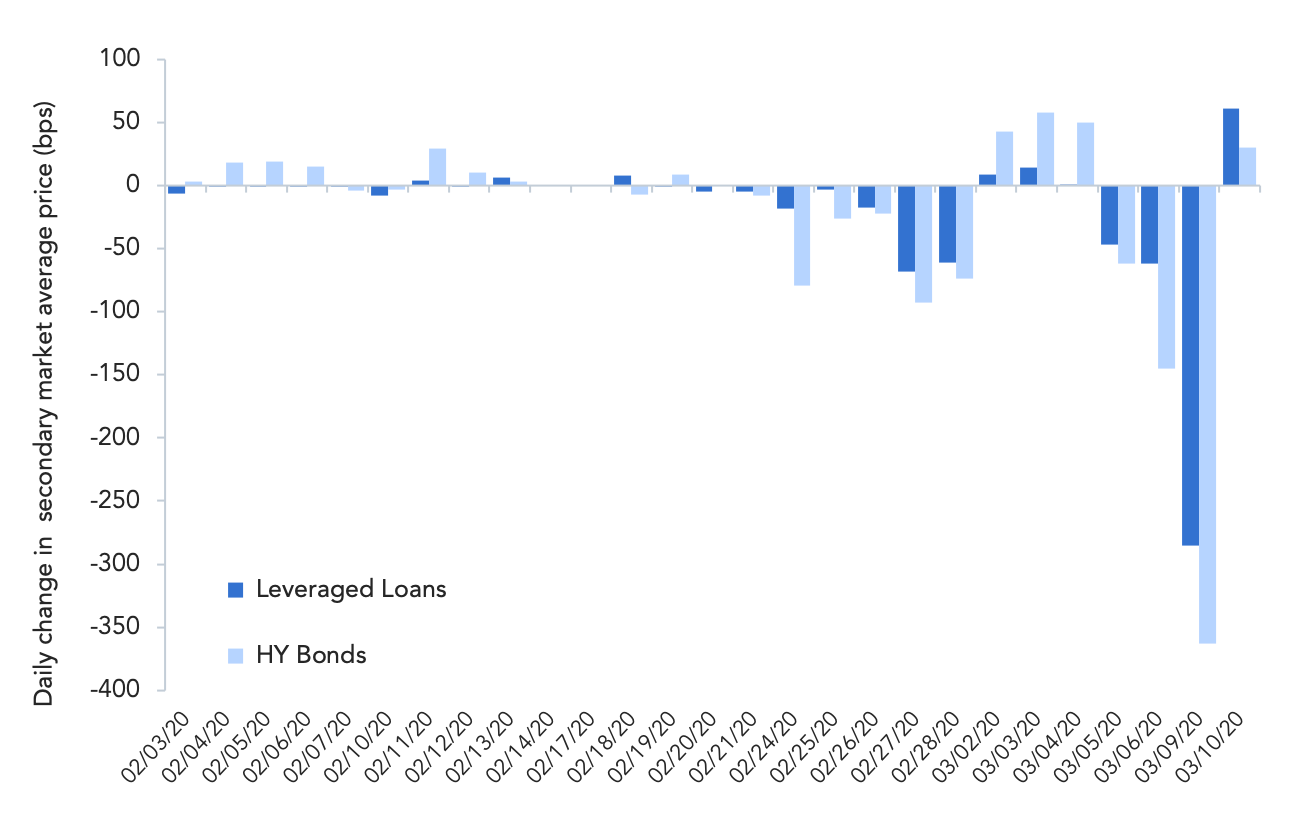
Source: Debtwire Par, Markit, ICE BofA
High yield bond and leveraged loan volatility has surged in the last three weeks. After initially brushing off coronavirus fears for most of the month of February, the leveraged loan and high yield bond markets started to react in the latter part of the month as equity market falls reverberated through to the credit markets. In the February 19 to March 10 time period, term loan prices in the secondary market have declined by 485bps to an average bid of 91.29 and the par-plus share has tumbled to 1% from 35%. The reaction in the high yield bond market has been more pronounced, with a higher degree of volatility and a greater propensity to bounce back and forth between losses and gains on a daily basis. Prices have dropped by nearly 700bps since February 19 and yields on the ICE BofA US High Yield Bond index have widened to 7.05% as of March 10 from 5.02%.
In response to the evolving risks to economic activity, the Federal Reserve cut its benchmark interest rates by a half-percentage point on March 3. The rate cut looks set to prompt more outflows from retail loan funds. According to one buysider, “the rate cut was definitely not helpful and it won’t help secondary loan prices as some retail funds may now sell in anticipation of redemptions.



Latest news

Top 50 BDCs Accounted for 75% of Nonaccrual Loan Cost in Q2’26
The 50 largest BDCs, on the basis of total debt investments as of the second quarter of 2026, accounted for 75% of the total aggregate reported value of nonaccrual debt at cost and fair value.

US private debt AUM ($B) by channel
In 2025 and the early part of 2026, the retail channel added AUM to the asset class at a much faster rate than institutional investors in both regions, with growth rates of 43.7% globally, 41.4% in the US, and 73. 1% in Europe through the beginning of 2026 compared with year-end 2024 figures.
