



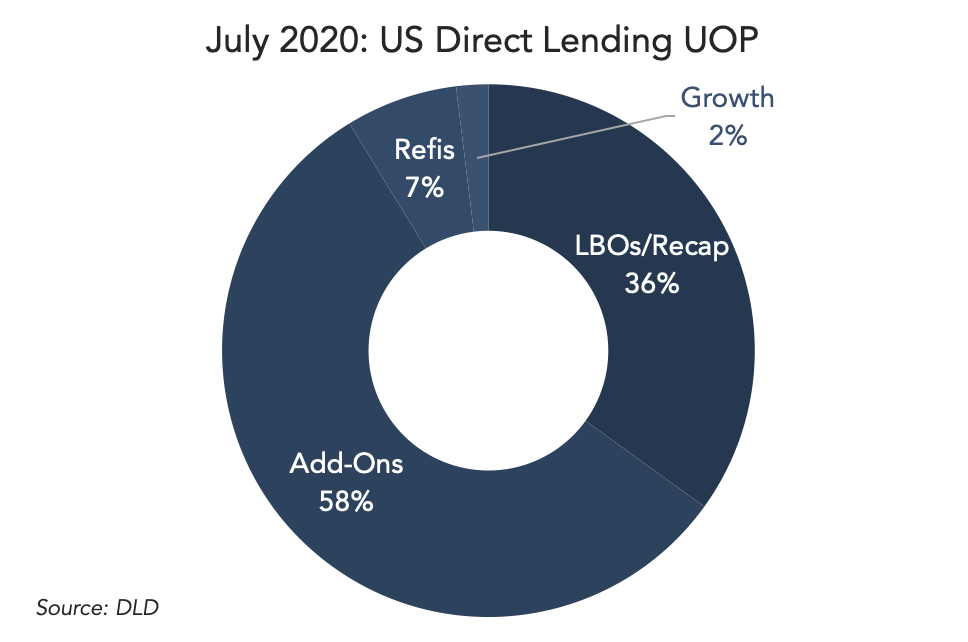
There’s no clear path forward yet, but lending began to slowly rebuild in July. The second quarter gave arrangers more time to evaluate portfolio company exposure to Covid-19, and while performance was down, it wasn’t as bad as many were expecting, based on DLD‘s conversations with managers.
Of the deals tracked in July by DLD, nearly 60% supported add-on M&A, building upon the share from June.
Not only are add-ons easier to sign from a credit perspective, they also have been less cumbersome to execute logistically, when travel is restricted and senior executives are accessible by video only. The anchor relationships are already in place.
Buyouts are down, but not out. LBOs/recaps accounted for 36% of July business, according to DLD.
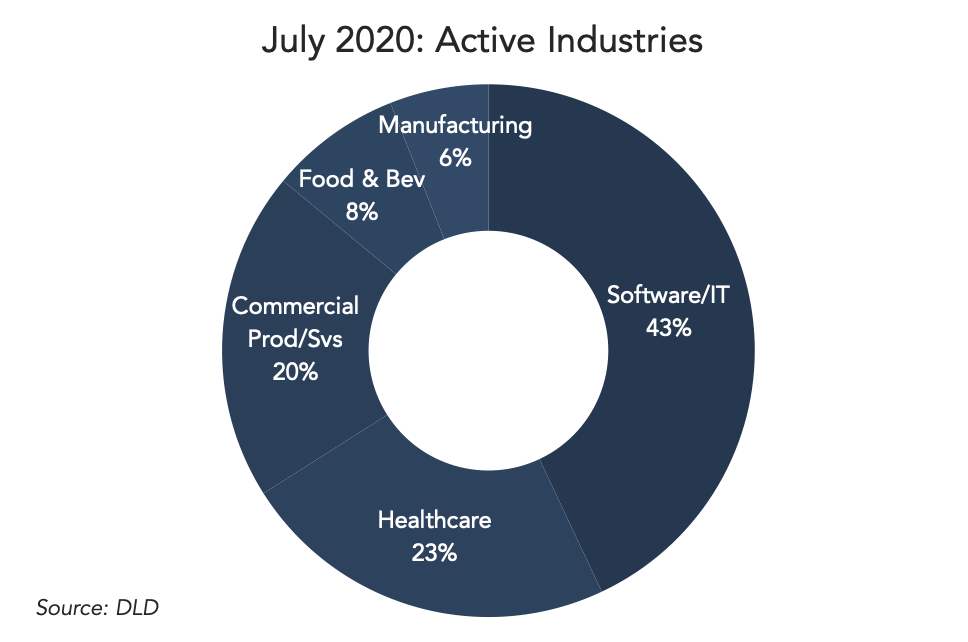
Sponsors are hunting the lower middle market for pandemic-resistant industries like enterprise software, insurance/financial services, non-elective healthcare services and products, as well as transportation & logistics, and food & beverage.
These types of companies haven’t fallen in value, lenders say. To the contrary, some are seeing higher purchase price multiples than before. Afterall, if they can thrive during a global pandemic, they must be bulletproof.
What’s out: travel, entertainment, retail, restaurants, oil & gas.



Latest news

Top 50 BDCs Accounted for 75% of Nonaccrual Loan Cost in Q2’26
The 50 largest BDCs, on the basis of total debt investments as of the second quarter of 2026, accounted for 75% of the total aggregate reported value of nonaccrual debt at cost and fair value.

US private debt AUM ($B) by channel
In 2025 and the early part of 2026, the retail channel added AUM to the asset class at a much faster rate than institutional investors in both regions, with growth rates of 43.7% globally, 41.4% in the US, and 73. 1% in Europe through the beginning of 2026 compared with year-end 2024 figures.
