



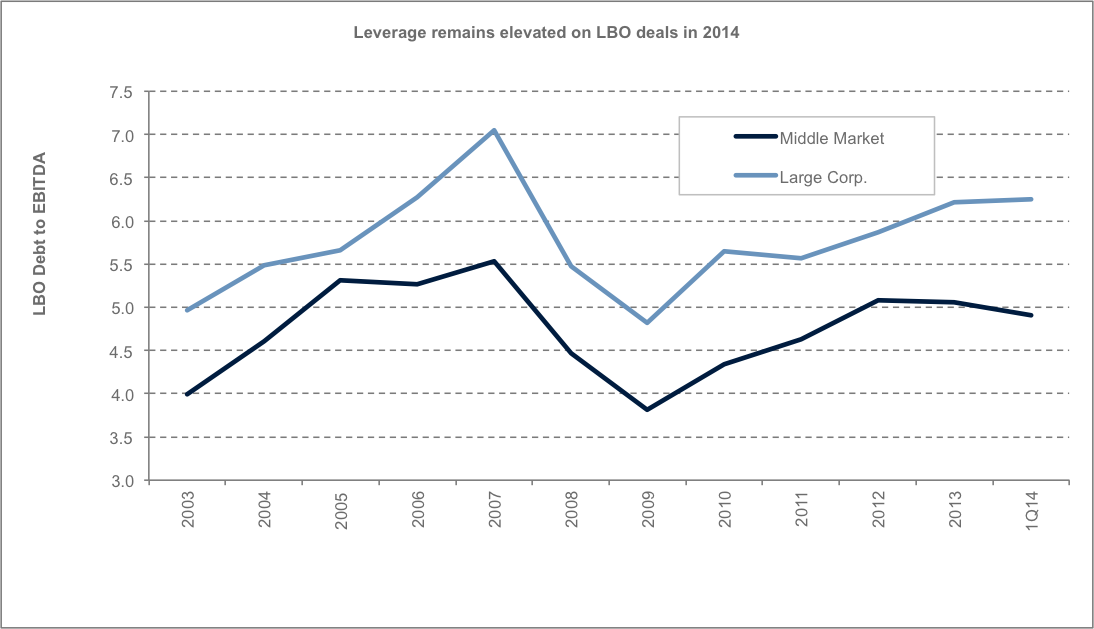
The average large corporate LBO debt to EBITDA level was 6.24 times in 1Q14, up from the 6.21 average seen in 2013. In 1Q14, the average multiple increased to 9.7 times from 9.3 times last year while equity contributions averaged 33.3%. Heading into 2Q14, several deals have already been announced with leverage in the 6-7.5 times area including Checkout Holdings, GYP Holdings and Rennaissance Learning.
Source: Thomson Reuters LPC



Latest news

Top 50 BDCs Accounted for 75% of Nonaccrual Loan Cost in Q2’26
The 50 largest BDCs, on the basis of total debt investments as of the second quarter of 2026, accounted for 75% of the total aggregate reported value of nonaccrual debt at cost and fair value.

US private debt AUM ($B) by channel
In 2025 and the early part of 2026, the retail channel added AUM to the asset class at a much faster rate than institutional investors in both regions, with growth rates of 43.7% globally, 41.4% in the US, and 73. 1% in Europe through the beginning of 2026 compared with year-end 2024 figures.
