



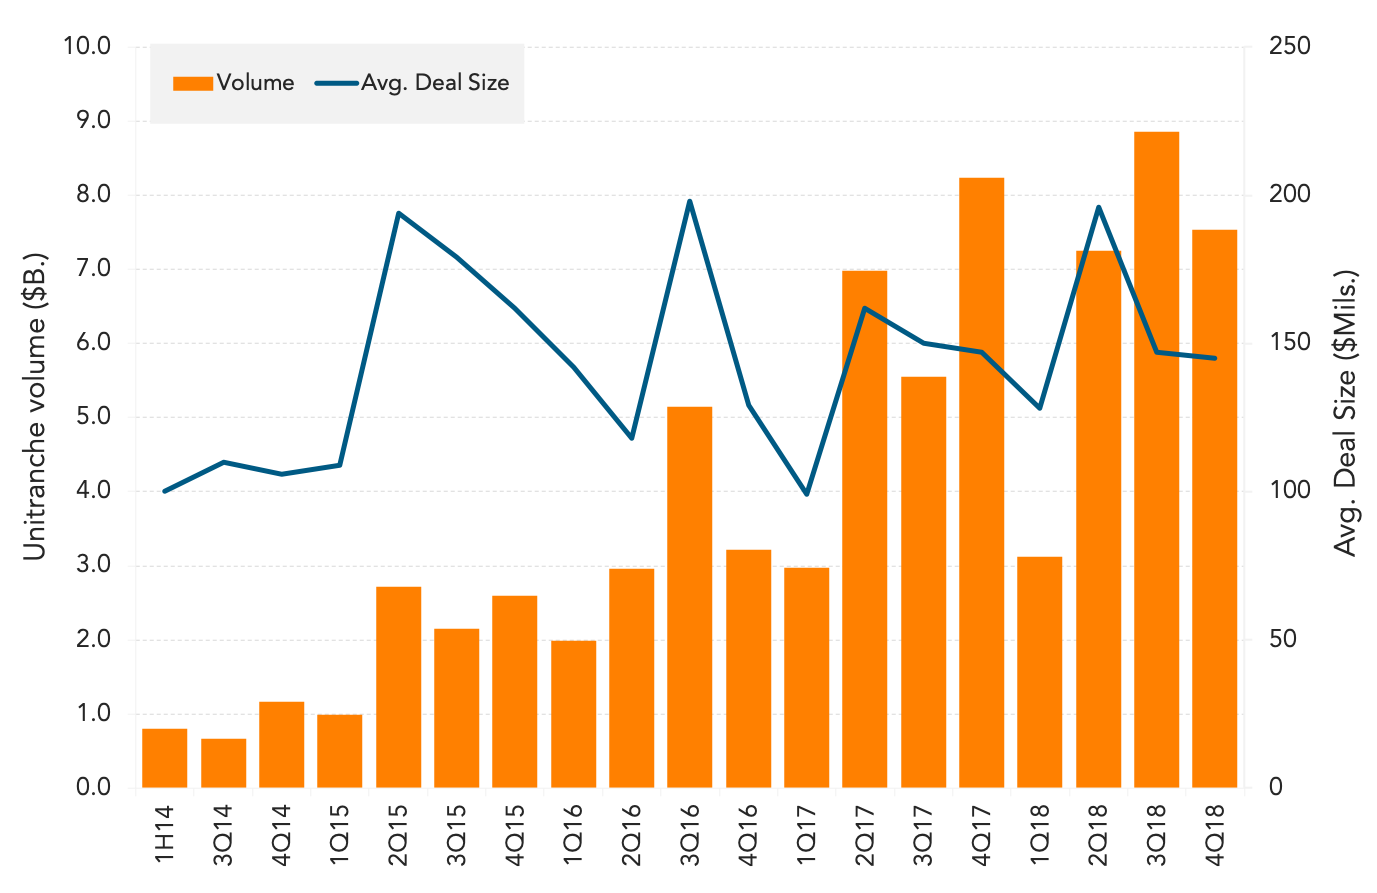
LPC tracked US$7.5bn in unitranche facilities closed in 4Q18, down slightly from the US$8.9bn tracked in 3Q18, but still quite robust. For the 2018 year, LPC tracked US$27bn in unitranche facilities closed, 13% higher than 2017’s levels. As many direct lenders continued to amass scale via record fundraising in 2018 and announce hold sizes in the $100M to $150M area, bigger unitranches were financed more regularly. In 2018, 58% of unitranches were sized over the $100M deal size thresdhold compared to only 48% in 2017. Despite some volatility in the leveraged market in 4Q18, the unitranche market remained super competitive and insulated as evidenced by leverage and pricing levels. In 4Q18, the average first lien leverage level on unitranche facilities rose meaningfully to 5.4 times, up from 5.1 times in 3Q18. Meanwhile, blended spreads averaged 587bps in 4Q18, up only a mild 5bps from 3Q18’s all time low of 582bps. In fact, roughly 57% of the unitranche facilities LPC tracked in 4Q18 were priced with a spread south of 600bps. On an annual basis, unitranche blended spreads averaged 598bps in 2018, down from 661bps in 2017. The spread differential between a “unitranche” execution and a “first lien / second lien” execution remained at an all time low of just 38bps in 4Q18, making the structure very cost efficient and appealing to sponsors. Given lenders believe volatility will be a recurring theme in the leveraged loan market in 2019, direct lenders are well positioned to put out more capital via unitranche exections this year.
Contact: Fran Beyers
frances.beyers@thomsonreuters.com




Latest news

PE dry powder
The capital that is being raised is flowing overwhelmingly to the largest, most established managers.

Middle market debt held by BDCs vs High yield vs Treasury yields
The blue line represents the current dividend yield of the VanEck BDC Income ETF (BIZD), which stood at 11.7% as…

LevFin Issuance Slows Across Products in August; DCM Remains a Bright Spot
The leveraged capital markets business continued to decelerate from just about every aspect, even for August standards. Overall issuance (including…