



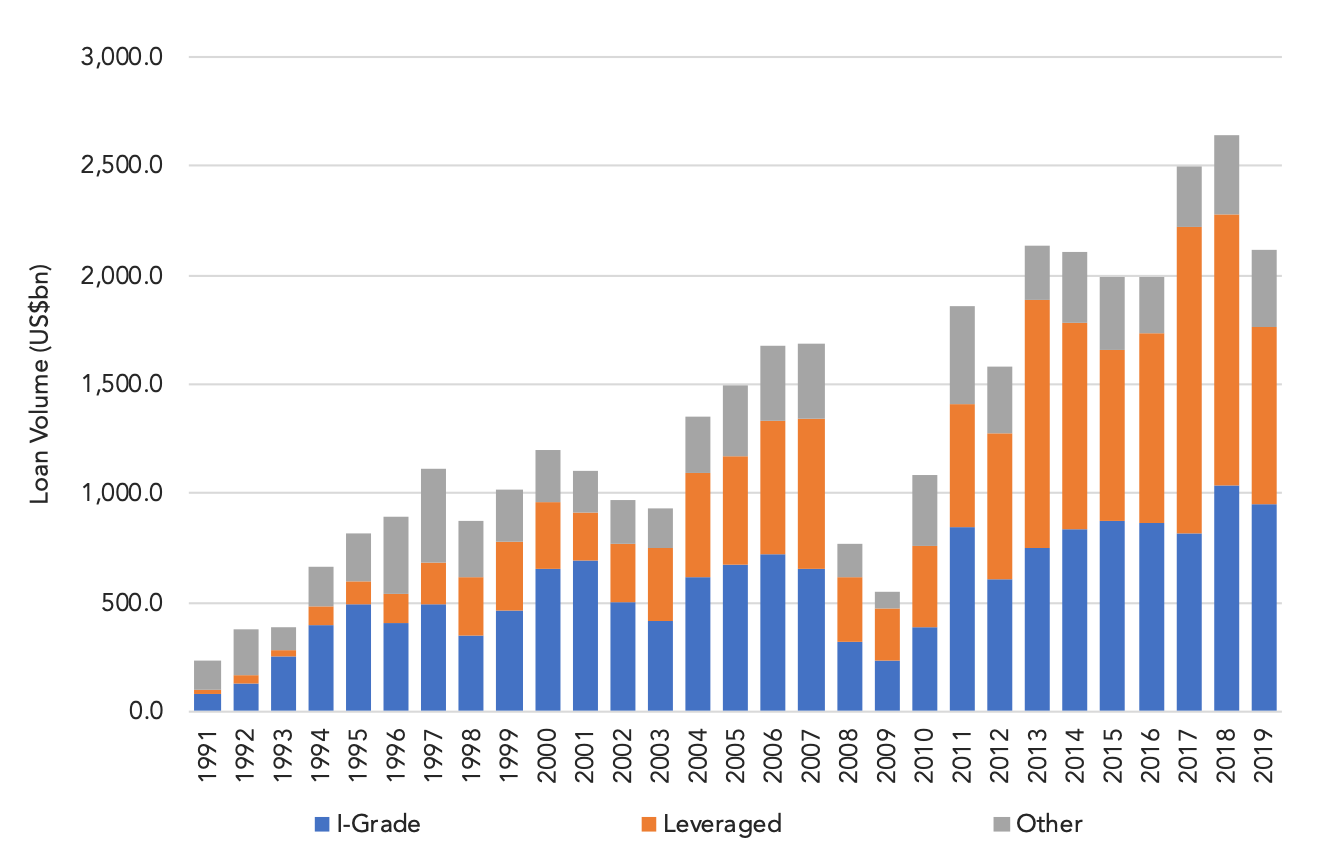
At US$2.1trn 2019 U.S. syndicated loan volume was down 20% compared to the record setting US$2.6trn raised the prior year amid a thinner pipeline of deals, higher market valuations and the long – if tangential – shadows cast by geopolitical and economic unease. Despite the year over year decline and the inherent lender disappointment which followed, as we enter a new decade, it is helpful to take stock of how much the loan market has in fact expanded and evolved in ten years. Total 2019 U.S. loan issuance is almost two times 2010 levels (less than US$1.1trn), highlighting the fall out from and the tremendous turnaround of a market that was crippled by global financial crises, the bankruptcies of firms deemed “too large to fail” and a full scale pull back of credit in late 2008 and throughout 2009. At nearly US$952bn, 2019 investment grade loan volume was down 8% compared to year ago historic totals, capped by limited M&A opportunities and less urgency to pull refinancings forward given ample lender liquidity. Nevertheless, total investment grade issuance was up nearly 2.5 times 2010 levels and nearly three times full year 2009 results. The evolution of the leveraged loan market has been even deeper and more dramatic. Less than US$808bn in leveraged loan volume was completed via retail syndication in 2019, a substantial 35% decline from year ago totals and the weakest results in four years. Higher corporate valuations provided limited opportunities for buyout deals of size while concerns about a possibly weakening economy contributed to market caution and bouts of heightened risk aversion. Yet the leveraged loan market of 2019 is not only two times greater than that of either 2009 or 2010, it is arguably savvier and more diverse. Despite the regulatory constraints which came into being following the 2008-2009 credit crisis, the leveraged loan market has not only remained open but has expanded to include direct lender capacity while loosening structures and terms to previously unseen levels.



Latest news

Top 50 BDCs Accounted for 75% of Nonaccrual Loan Cost in Q2’26
The 50 largest BDCs, on the basis of total debt investments as of the second quarter of 2026, accounted for 75% of the total aggregate reported value of nonaccrual debt at cost and fair value.

US private debt AUM ($B) by channel
In 2025 and the early part of 2026, the retail channel added AUM to the asset class at a much faster rate than institutional investors in both regions, with growth rates of 43.7% globally, 41.4% in the US, and 73. 1% in Europe through the beginning of 2026 compared with year-end 2024 figures.
