



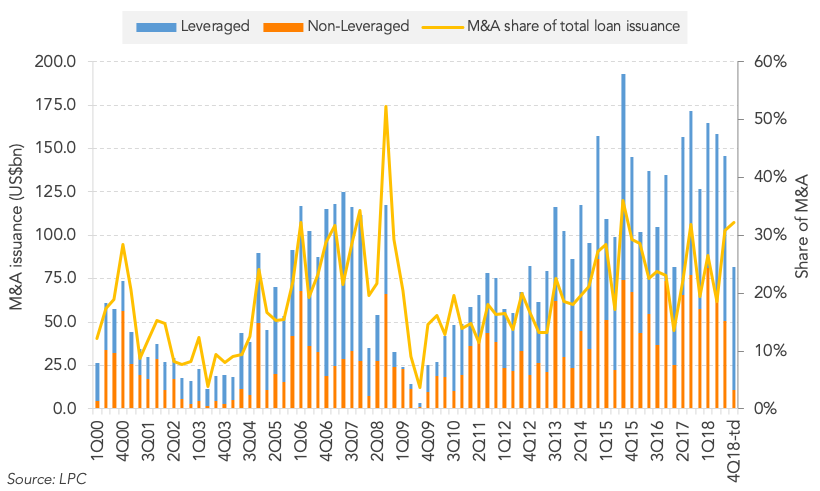
At around the halfway point in the quarter, US M&A activity has remained busy. Through November 14, there has been US$71bn in completed leveraged M&A issuance and US$10.6bn in completed non-leveraged M&A issuance. Those totals comprise a 32% share of M&A issuance for overall US loan issuance this quarter. For context, since 2010 the quarterly average M&A share of overall loan issuance is roughly 21%. Heading into the quarter, repricing activity was supposed to pick up from the lower levels seen in 3Q18.But the volatility that has rocked the equities market has led to secondary loan prices softening. In fact the 100 most liquid loans are now trading at their lowest level all year, 98.04, after trading as high as 98.91 on October 8th. With secondary loan prices trading lower, issuers have been less inclined to tap the market for a repricing, which has led to a greater share of M&A deals. LBO issuance in particular has been strong. So far this quarter there has been US$32bn in LBO issuance, a 137% increase year-over-year. In the high grade market, while 4Q18 completed non-leveraged M&A issuance totals are currently lower, IBM’s jumbo US$20bn bridge loan is in the pipeline and will provide a boost once it has been syndicated.
Contact: David Puchowski
David.Puchowski@thomsonreuters.com




Latest news
Q2'26 BDC analysis shows additional 184 bps of nonaccruals at cost
In a universe of 173 business development companies, or BDCs, Octus identified a total of $9.5 billion of debt (at cost) in nonaccrual status reported in the second quarter of 2026, a slight decline of 5% from $10 billion in the first quarter of 2026.

Reading the Board
The story changes depending on which numbers you’re counting.
Private Credit Defaults 101: Different Numbers, Different Stories
In Season 2 of Billions, Bobby Axelrod takes his lawyer Orrin Bach to an empty Yonkers racetrack in the dead of night.