


After a tumultuous October, BDC price/NAV turns back up amid favorable earnings

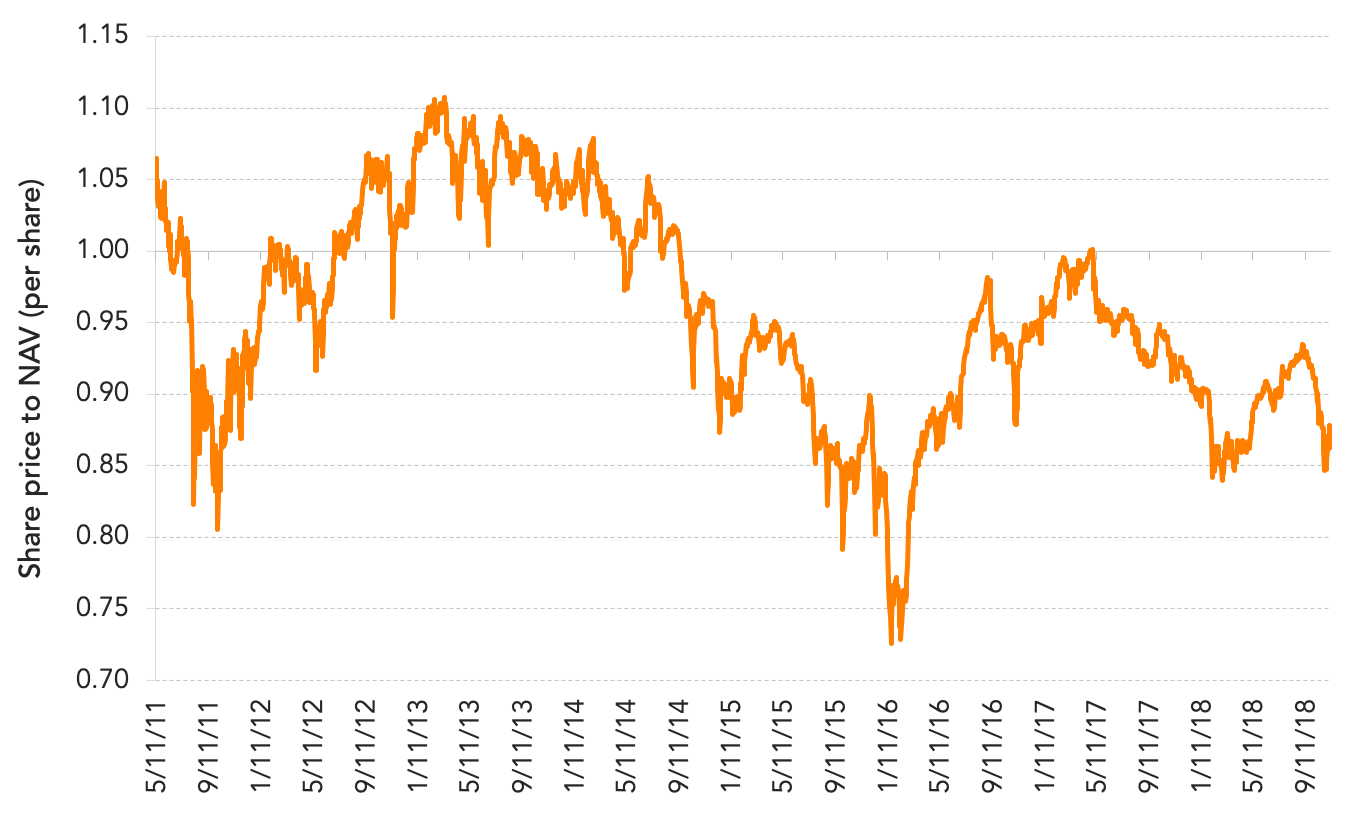
BDC share prices are back on the mend this month amid favorable 3Q18 earnings following an extremely volatilie October which wiped out price based returns for many. After going into negative territory in October, the Wells Fargo BDC Index is recovering lost ground with a 3.68% year to date return. The average share price to net asset value has recovered to 0.88x this week after falling to a low of 0.84x in late October. And solid 3Q18 earnings for some are helping to lift BDC share prices this month. Bellwether Ares Capital reported core earnings that were 25% higher over the same period a year ago driven by higher portfolio yields and continued increases in Libor. Ares noted the middle market remains insulated and highly competitive despite some modest investor pushback in the syndicated market. Several other BDCs have seen positive share price movement following solid earnings releases including Goldman Sachs GSBD (up 9% in last 5 days), WhiteHorse ( up 10% in last 5 days), TPG Specialty Lending (up 5% in last 5 days), Main Street (up 6% in last 5 days), Blackrock (up 6% in last 5 days)and Solar Capital (up 5% in last 5 days). A myriad of BDCs continue to focus on improving shareholder value. Alcentra (up 13% in the last 5 days) has added seasoned professionals to its management and direct lending team, lowered its management fee 25bps, while authorizing a new $10M share buyback program. Alcentra stated on its call it is continuing to rotate into upper mid-market senior secured loans. While Capitala Finance also reiterated its progress of rotating its portfolio by moving away from second lien and subordinated debt and moving into more senior secured assets. Apollo (up 8.9% in last 5 days) is another BDC in the process of diversifying its portfolio and moving into more senior assets. Despite encouraging earnings from several BDCs so far, investors continue to penalize many BDCs who have failed to align their fee structure with performance. BDC Collateral shows that based on 50 public BDCs, roughly 39 (78% of the universe) are still trading below their net asset value.
Contact: Fran Beyers
frances.beyers@thomsonreuters.com



Latest news

US Leveraged Loans Return 3.36% to Investors YTD
The Bloomberg US Leveraged Loan Index (Ticker: LOAN) returned 0.96% in August and has gained an additional 0.28% through September…

PE dry powder
The capital that is being raised is flowing overwhelmingly to the largest, most established managers.

Middle market debt held by BDCs vs High yield vs Treasury yields
The blue line represents the current dividend yield of the VanEck BDC Income ETF (BIZD), which stood at 11.7% as…