



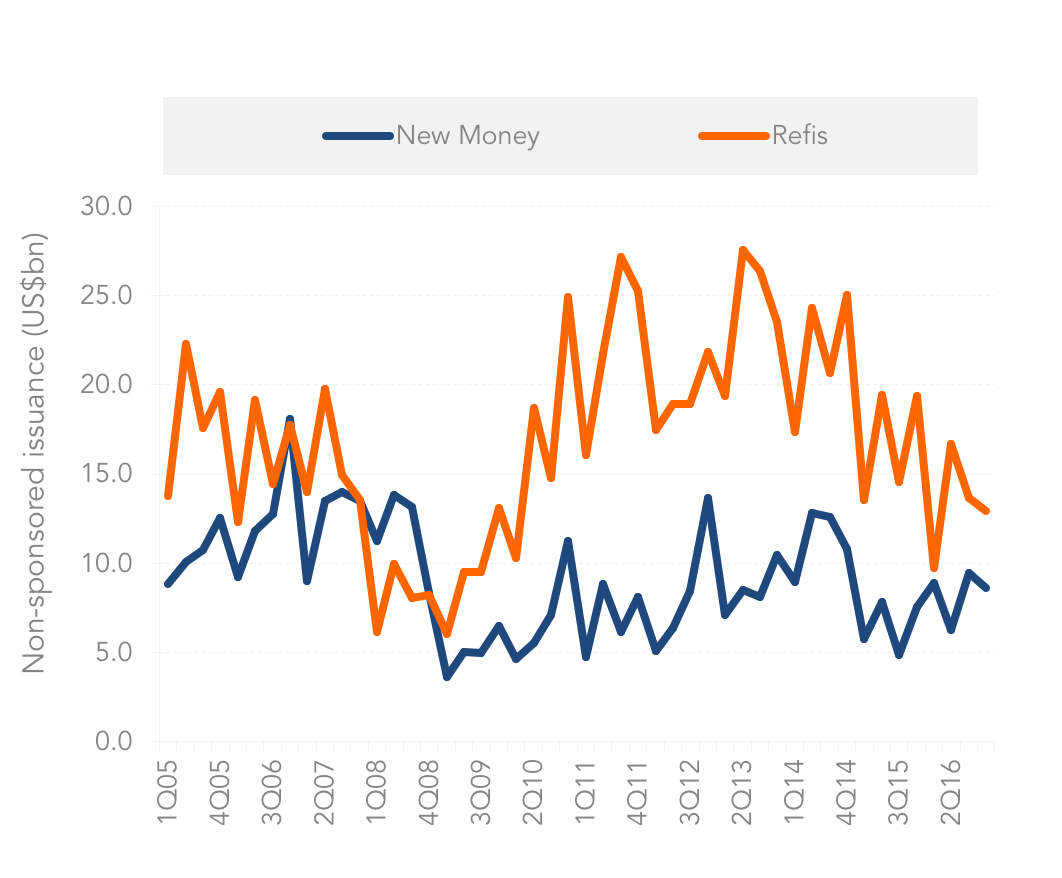
Non-sponsored lending dropped to US$86bn in 2016 from US$93bn in 2015. In contrast with every other major market segment (overall, leveraged, investment-grade, institutional, middle market sponsored) which witnessed a quarter over quarter increase in volume in 4Q16, non-sponsored middle market lending of US$22bn, was down 7%. Refinancings, the main driver of volume since the credit crisis, were down 21% in 2016 to US$53bn. Most of the refinancings were done in previous years and there was not that much in the form of opportunistic refinancings as pricing has somewhat stabilized in this market. On the other hand, new money lending was up in 2016, the only piece of good news in otherwise dire figures. Non-sponsored new money issuance jumped 22% to US$33bn in 2016, but it was still far away from 2014’s US$45bn. The increase was mostly due to upsizings as issuers took advantage of banks’ willingness to up their hold levels to increase their credit lines. M&A activity remained at low levels in 2016. At US$8.2bn, M&A lending was down from US$9.2bn in 2015. There were too many uncertainties throughout the year and for those companies that were looking to expand through M&A, the gap between buyers’ and sellers’ expectations was too wide.



Latest news

Top 50 BDCs Accounted for 75% of Nonaccrual Loan Cost in Q2’26
The 50 largest BDCs, on the basis of total debt investments as of the second quarter of 2026, accounted for 75% of the total aggregate reported value of nonaccrual debt at cost and fair value.

US private debt AUM ($B) by channel
In 2025 and the early part of 2026, the retail channel added AUM to the asset class at a much faster rate than institutional investors in both regions, with growth rates of 43.7% globally, 41.4% in the US, and 73. 1% in Europe through the beginning of 2026 compared with year-end 2024 figures.
