



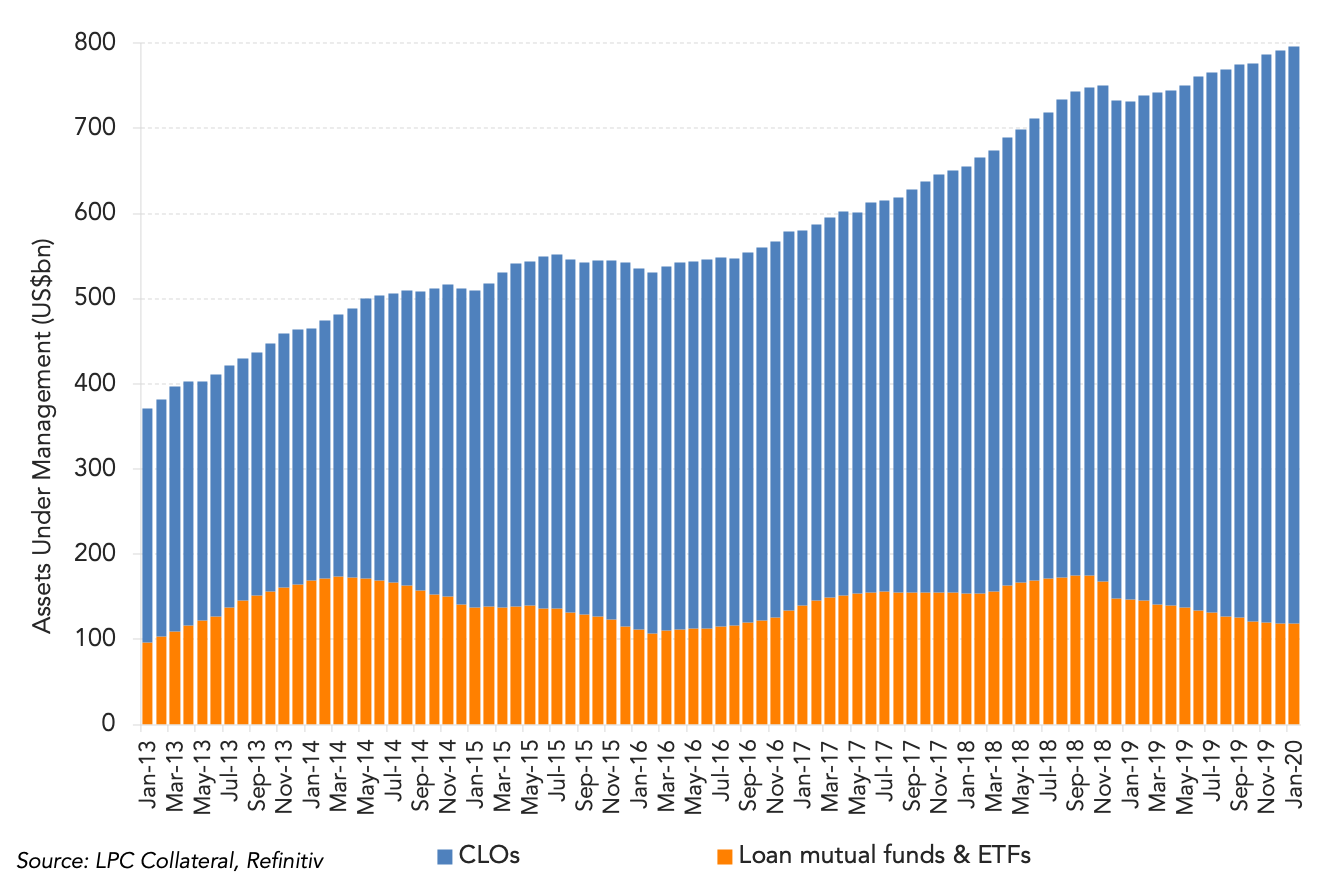
US CLO assets under management (AUM) have climbed to US$677.24bn in January after a 15% increase last year to US$673bn. Roughly 60% of the assets are in CLOs with a 2017 or later vintage with 8% of assets in vintages from 2014 to 2016. European CLO outstandings climbed 30% last year to €124.58bn and ended January at €126.23bn. Conversely, the AUM (market value) for loan mutual funds and ETFs shrank 19% last year to US$118.91bn. However, in January the trend reversed. After 16 consecutive months of declining values, loan mutual funds and ETFs AUM were up US$330m to US$119.24bn. Outside of the last three months, the last time AUM dipped under US$120bn had been September 2016. Retail fund outflows challenged the technicals in the loan market last year resulting in the absence of a less risk sensitive natural buyer. This tended to increase the severity of the price movements in the secondary when an issuer faced difficulties. Although new CLO issuance had a slow start last year, which was compounded by broader market volatility, it reached US$119bn, compared to 2018’s US$127.74bn. CLOs manage 57% of current institutional loan outstandings, up from 50% at the end of last year while retail loan funds’ share has hovered in the single digits for the past three months at 9%.



Latest news

Top 50 BDCs Accounted for 75% of Nonaccrual Loan Cost in Q2’26
The 50 largest BDCs, on the basis of total debt investments as of the second quarter of 2026, accounted for 75% of the total aggregate reported value of nonaccrual debt at cost and fair value.

US private debt AUM ($B) by channel
In 2025 and the early part of 2026, the retail channel added AUM to the asset class at a much faster rate than institutional investors in both regions, with growth rates of 43.7% globally, 41.4% in the US, and 73. 1% in Europe through the beginning of 2026 compared with year-end 2024 figures.
