



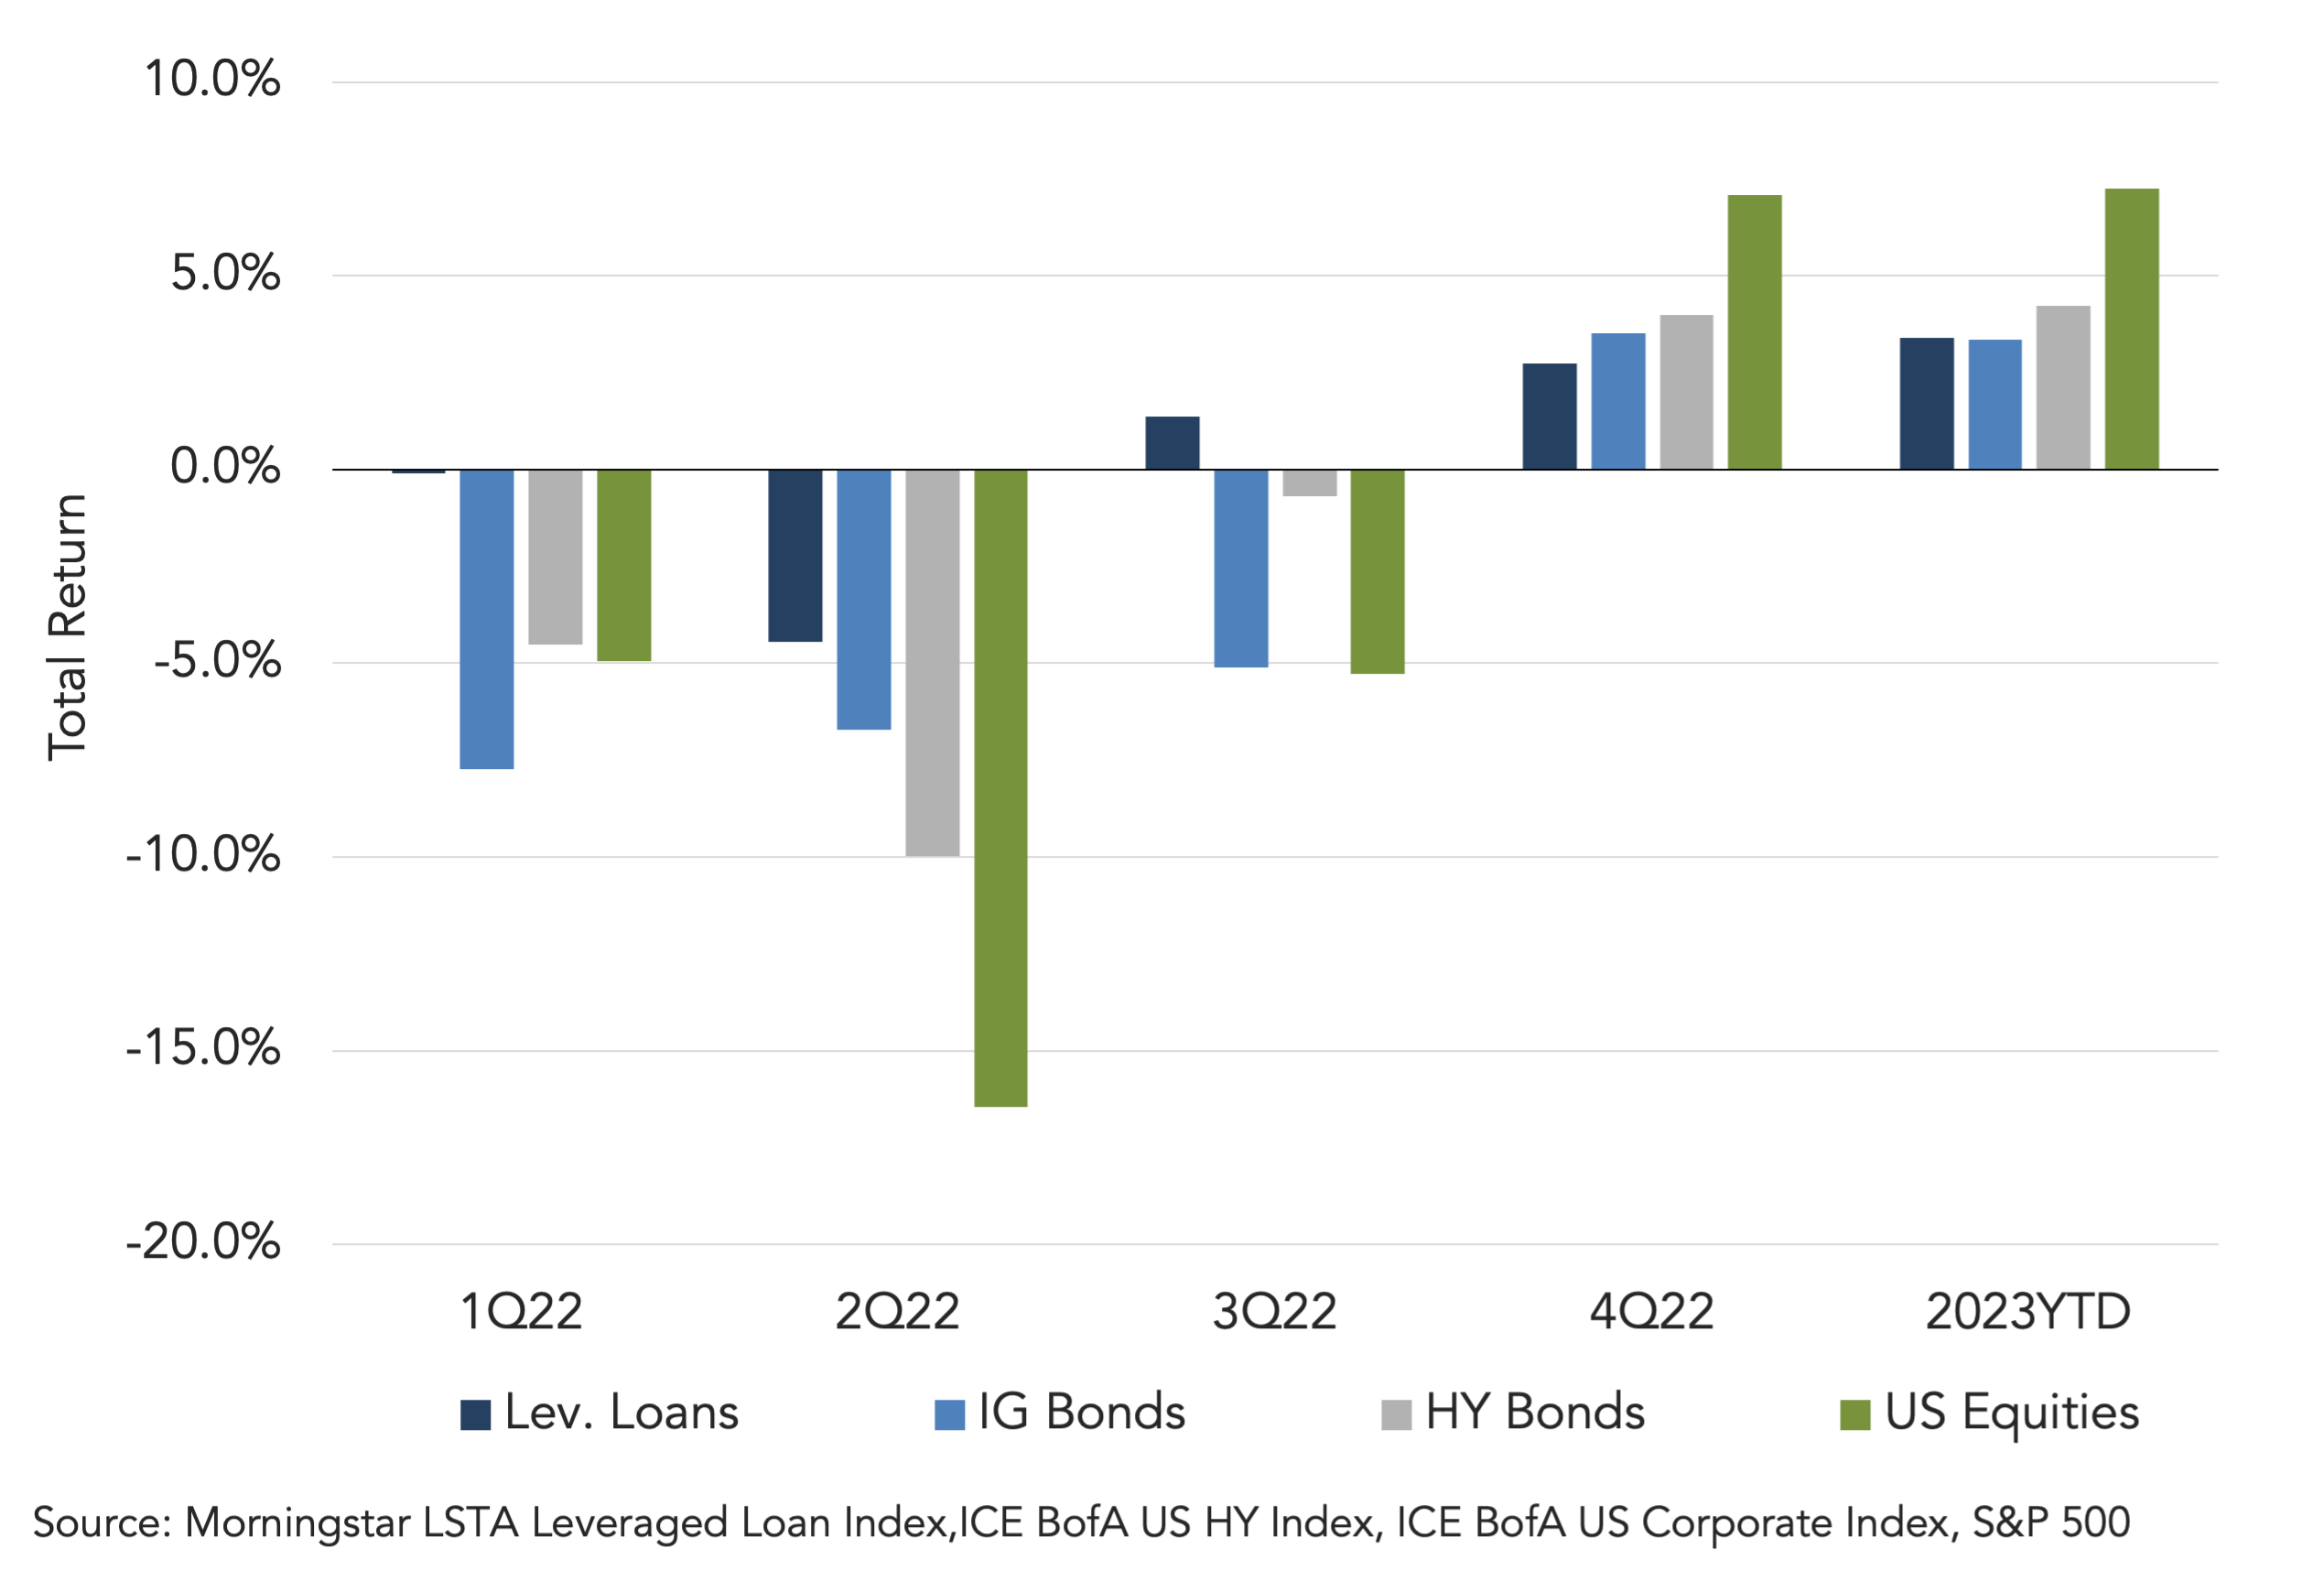
Total returns on US corporate credit have jumped to start the year, driven by more favorable sentiment across the capital markets, as investors react to a third straight month of declining inflation and the expectation that the Federal Reserve is closer to completing rate hikes. The risk-on environment was led by US equities, with the S&P 500 7.2% higher as of Wednesday, February 8, followed by US HY bonds at 4.2%, US IG bonds at 3.3% and US leveraged loans at 3.3%. Loan returns have not been this high since 2Q20, with market value gains combining with high interest rates, driving total returns for floating rate loans. Notably, leveraged loans gained across the credit spectrum, with Single-B rated and Triple-C rated credits up 247bp and 180bp, respectively, according to index data. This contrasts 4Q22 when the rebound in the secondary market closely tracked credit quality, sending Triple-C credits 6pts lower. For corporate bonds, the average HY bond price is 325bp higher to 89.1, and IG bonds up 272bp to the 91.8 context, according to ICE Bofa Index data, tightening the yield-to-worst to its lowest level since August and April of 2022, respectively. Despite the bullish start to the year, the market remains volatile and highly attuned to the macroeconomic picture, as the surprisingly strong jobs number indicated earlier this month, but also to policymaker’s views with the expectation that the full brunt of monetary tightening has yet to reverberate across businesses and consumers.
(Past performance is no guarantee of future results.)



Latest news

Top 50 BDCs Accounted for 75% of Nonaccrual Loan Cost in Q2’26
The 50 largest BDCs, on the basis of total debt investments as of the second quarter of 2026, accounted for 75% of the total aggregate reported value of nonaccrual debt at cost and fair value.

US private debt AUM ($B) by channel
In 2025 and the early part of 2026, the retail channel added AUM to the asset class at a much faster rate than institutional investors in both regions, with growth rates of 43.7% globally, 41.4% in the US, and 73. 1% in Europe through the beginning of 2026 compared with year-end 2024 figures.
