



Flex activity in the leveraged loan market amped up in February as market volatility continued and lenders tried to push deals through that had been shelved since last year. Thomson Reuters LPC’s Flex Factor, which aggregates price and structural flex activity to gauge investor sentiment, increased to an average score of 3.2 last month, up from January’s 2.1. The higher the score, the more price and structural changes were required to get deals done. Meanwhile, the percentage of flexed deals which included a structural flex increased to 57% in February, its highest share since November’s 74% share.
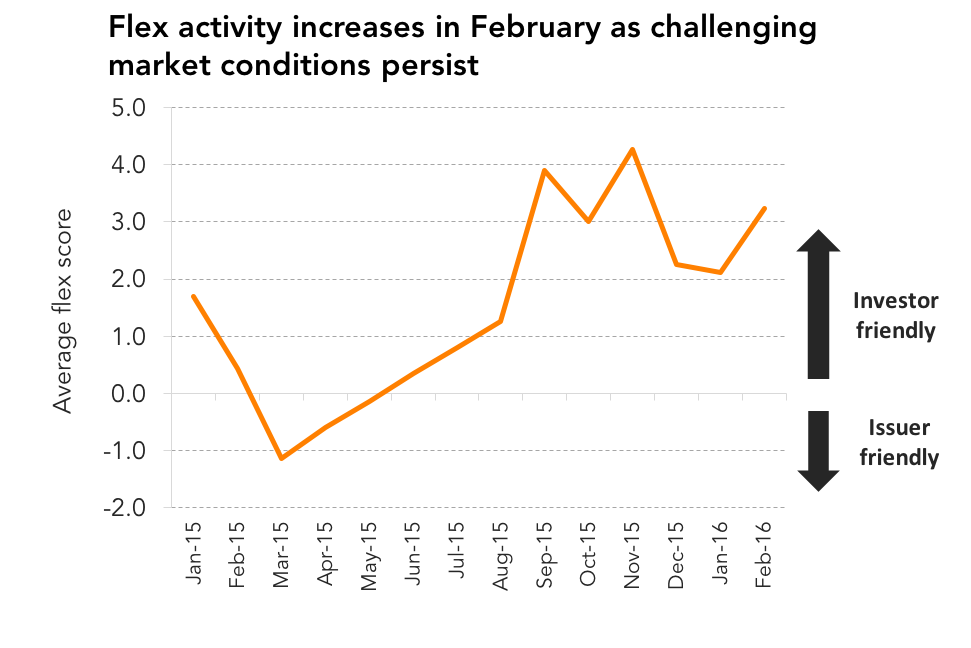
Solera Holdings widened its OID to 97 from 98 and made 15 changes to documentation which included extending soft call protection, removing the MFN sunset clause and a reduced payment basket among several others. Solera’s loan originally launched in December but syndication was delayed until market conditions improved. Earlier in February, Kraton Polymers’ hung loan saw its OID widen at a deep discount of 90. Last week, Vivid Seats Ltd’s LBO loan also had a heavy price flex. The OID on the company’s loan widened 5 points to 93 while the spread was increased by 25bp over the wide end of guidance. The 3.2 average Flex Factor score for February was the highest monthly average since November’s 4.3. Flex activity has weighed in investors’ favor since June when market conditions first showed signs of uncertainty. But it wasn’t until September that market volatility caused Flex Factor scores to spike, staying above a monthly average of 2 ever since.
Register now! TR LPC’s 4th Annual Middle Market Loans Conference on April 27, 2016.
Contact: David Puchowski
David.Puchowski@thomsonreuters.com




Latest news


Fitch Ratings’ U.S. Private Credit Default Rate Rose to 6.3% in August 2026
Fitch Ratings recorded a U.S. Private Credit Default Rate (PCDR) of 6.3% for the trailing 12 months (TTM) ended August 2026, up from 6.1% in July 2026 and a record high.
