


Leverage on institutional middle market deals climbs on new money deals in 1Q17

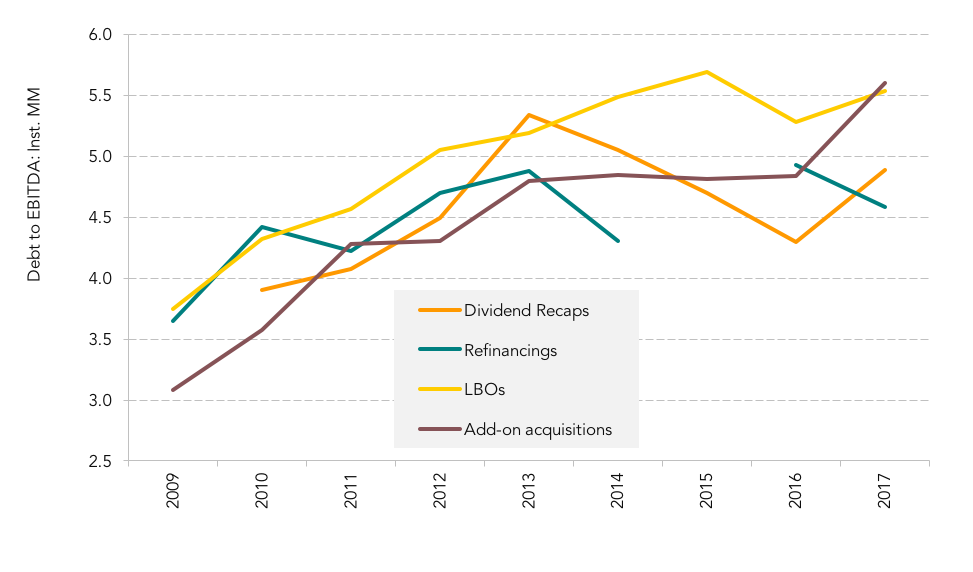
Interest in middle market loans from large corporate investors tends to wax and wane based on market conditions, but currently investors are super receptive to these smaller credits given a supply demand imbalance in the leveraged loan market. As a result, leverage levels on institutional middle market deals are rising in 2017 across most deal purposes. Leveage on dividend recap deals peaked in 2013 at 5.3 times and was in decline through 2016 down to 4.3 times as large corporate buyers were less willing to stretch on smaller credits. However, in 1Q17 the figure has begun to climb again and is averaging 4.9 times so far as CLOs and other larger investors hunt for yield and snap up larger middle market credits with ratings. This trend is also clear on institutional middle market LBOs and add-on acquisitions. In fact, leverage of 5.6 times on add-on acquisition financings is at the highest level post credit crisis since LPC began tracking these figures. The average leverage level on institutional middle market LBOs has crept up to 5.5 times in 1Q17, up from 5.3 times last year, but still slightly below the peak tracked in 2015 of 5.7 times. Deals hitting the market for refinancings seem to have the lowest average leverage levels at just 4.6 times and this is the only deal purpose with lower leverage levels compared to 2016. While this stat has stayed relatively conservative relative to M&A deals, issuers are getting covenant-lite structures on some of these refinancings so buyers beware.
Register to join TRLPC’s 5th Annual Middle Market Loan Conference



Latest news

Behind the Scenes
Climbing toward the average is a very different story than surpassing it.

European mid-market direct lending margins face steady compression since 2024
European mid-market direct lending margins have seen consistent compression over recent years but recorded a slight increase in the second quarter of 2026…
Private Credit Defaults 101: Now Streaming
Every big theatrical release eventually makes its way to streaming. It gives people who missed it in theaters a chance to catch up, and lets those who saw it go back for a second look at what they missed the first time.