



Decline felt across regions
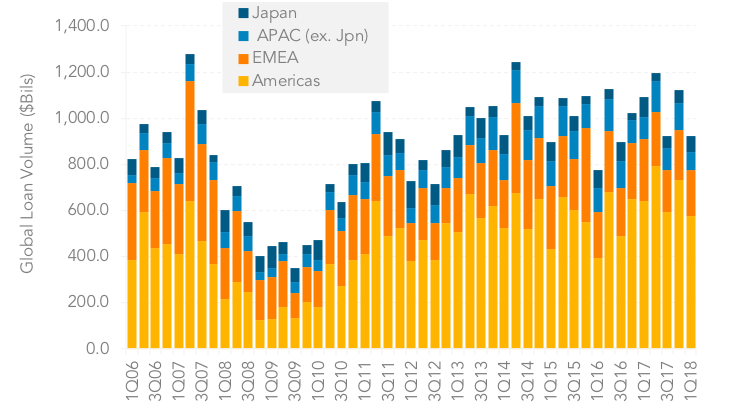
1Q18 global loan volume tumbled 15% year over year to log less than US$924bn during the first three months of the year. No region was spared a more limited pipeline of deals. The Americas observed an 11% drop in regional issuance with less than US$574bn in loan assets working their way through the market, to make up over 62% of total global volume. The results marked the lowest quarterly total in over a year. Regional lenders noted that conversations around new lending opportunities were ripe given the flurry of corporate friendly regulatory rollbacks, but that potential issuers, while eager to do deals, were nonetheless more measured in the near term as they worked through how to adjust to the regulatory changes. In Europe, the Middle East and Africa, loan volume was down 25% year over year in 1Q18 at US$200bn. A dearth of completed M&A deals coupled with a slowdown in refinancing activity accounted for the shortfall. Demand for deals nonetheless remained high with lenders noting that the 2Q18 calendar was steadily building and that the market was only constrained by cross-border regulatory scrutiny which caused the slowdown of executed deals. Asia Pacific (ex Japan) and Japan loan volume were down 17% and 18% respecitvely in 1Q18 at US$80.5 and less than US$70bn of issuance. Lending in the region was stymied by limited M&A as well as broader economic slowdown in China.
Contact: Maria Dikeos
maria.dikeos@thomsonreuters.com



Latest news

Top 50 BDCs Accounted for 75% of Nonaccrual Loan Cost in Q2’26
The 50 largest BDCs, on the basis of total debt investments as of the second quarter of 2026, accounted for 75% of the total aggregate reported value of nonaccrual debt at cost and fair value.

US private debt AUM ($B) by channel
In 2025 and the early part of 2026, the retail channel added AUM to the asset class at a much faster rate than institutional investors in both regions, with growth rates of 43.7% globally, 41.4% in the US, and 73. 1% in Europe through the beginning of 2026 compared with year-end 2024 figures.
