



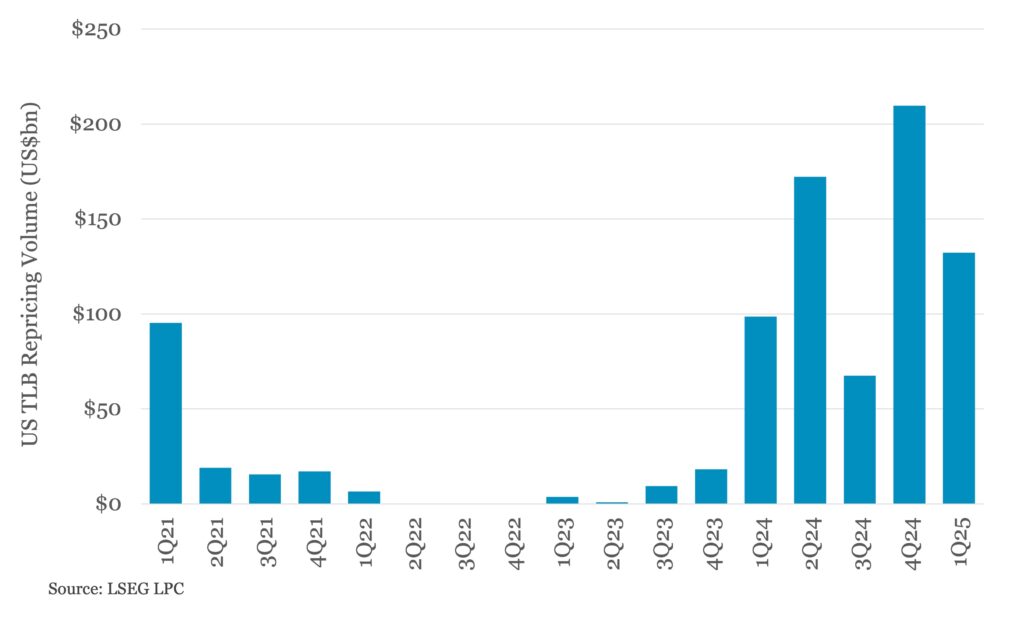
The secondary loan market had a deceivingly challenged quarter. Par-plus loans accounted for more than 53% of the market at the start of the year, peaked above 56% in mid-January, then ended 1Q25 at a three-month low of 12%. Although selling was largely contained, given the share of loans trading between 98 and par more than doubled on the quarter to 64%, it was enough of a pullback to take the repricing trade off the table for those who were considering. Institutional loan repricings declined each month throughout the quarter, and just as progressively as they had expanded during 4Q24, with mark-to-market executions coming out strong in January (US$68bn) before slipping in February (US$46bn), only to further stagger in March (US$18bn) – the slowest month for repricings since August of last year. Institutional loan repricings for 1Q25 came in at US$132bn, down 36% from 4Q24’s all-time high (US$210bn) despite the third busiest quarter for repricings on record. Based on our latest market survey results and given the persistently softer secondary trading backdrop, many expect a lighter repricing calendar in the months ahead.



Latest news

Top 50 BDCs Accounted for 75% of Nonaccrual Loan Cost in Q2’26
The 50 largest BDCs, on the basis of total debt investments as of the second quarter of 2026, accounted for 75% of the total aggregate reported value of nonaccrual debt at cost and fair value.

US private debt AUM ($B) by channel
In 2025 and the early part of 2026, the retail channel added AUM to the asset class at a much faster rate than institutional investors in both regions, with growth rates of 43.7% globally, 41.4% in the US, and 73. 1% in Europe through the beginning of 2026 compared with year-end 2024 figures.
