


1Q17 M&A volume down 32% year over year as market waits on policy guidance out of Washington

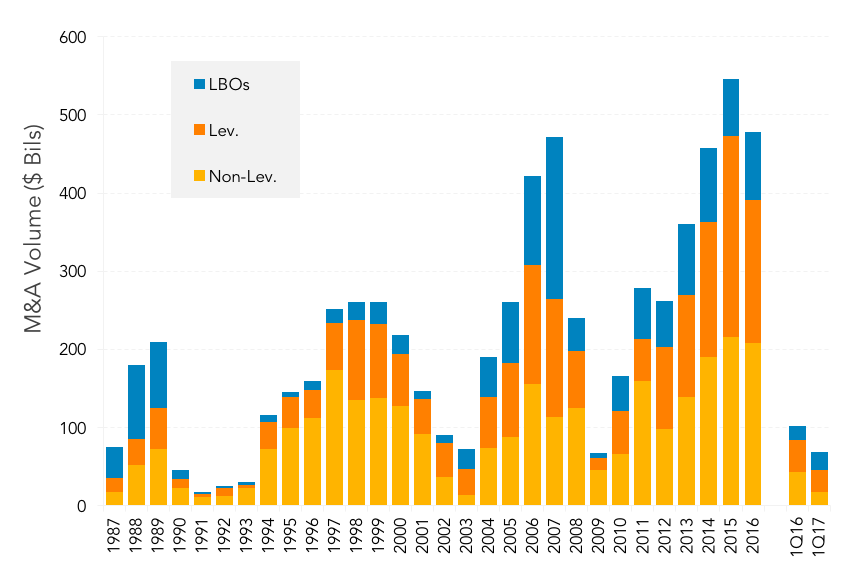
M&A loan issuance declined dramatically year over year to log less than US$70Bn in 1Q17, down 32% compared to the year ago results (US$102Bn). This represented the lowest quarterly results since 1Q13. Although some of the market shortfall on a percentage basis should be qualified in that jumbo financings for Avago Technology and Kraton Polymers which were completed in 1Q16 were in fact structured in 2015, the market took a very real pause in 1Q17 as issuers waited on the new administration in Washington to provide greater clarity around key policy plans including tax reforms, healthcare, trade and the repatriation of corporate funds. High grade lenders pointed out that while there were several public efforts as well as private discussions around prospective M&A deals, very little came together in the first three months of the year. At less than US$18Bn non-leveraged M&A was down 59% year over year. Leveraged issuers similarly struggled despite the fact that PE sponsors were sitting on quite a bit of dry powder by most acounts. At US$23Bn, LBO volume was up modestly year over year, while leveraged corporate M&A loan volume was down 30% in 1Q17 compared to the same period last year.
Register to join TRLPC’s 5th Annual Middle Market Loan Conference



Latest news

Top 50 BDCs Accounted for 75% of Nonaccrual Loan Cost in Q2’26
The 50 largest BDCs, on the basis of total debt investments as of the second quarter of 2026, accounted for 75% of the total aggregate reported value of nonaccrual debt at cost and fair value.

US private debt AUM ($B) by channel
In 2025 and the early part of 2026, the retail channel added AUM to the asset class at a much faster rate than institutional investors in both regions, with growth rates of 43.7% globally, 41.4% in the US, and 73. 1% in Europe through the beginning of 2026 compared with year-end 2024 figures.
