


Supported by increase in high grade financings, 2Q25 US M&A loan volume up 64% y-o-y; LBO activity declines

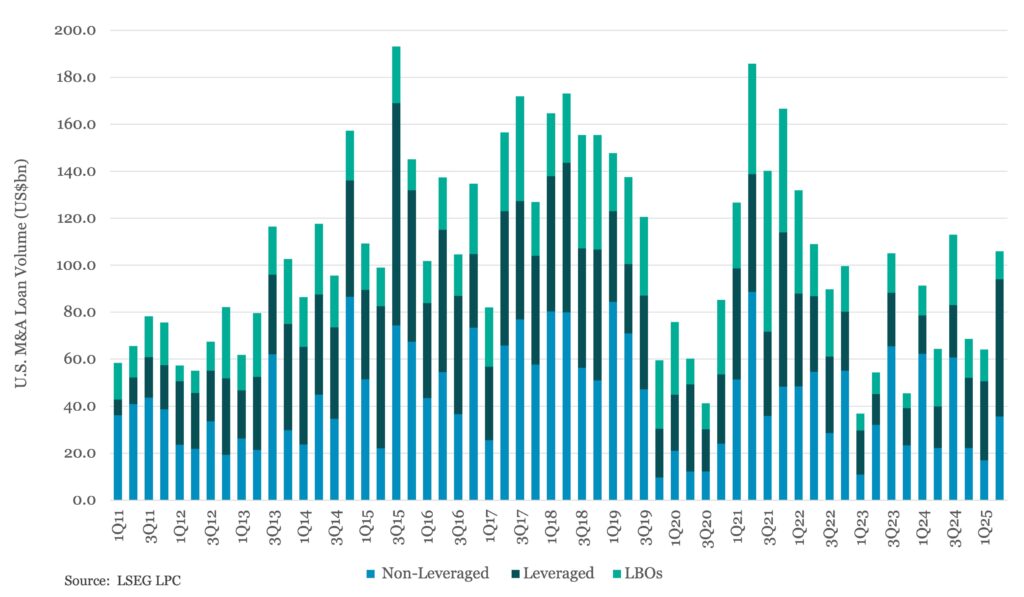
Brushing aside tariff woes, inflation concerns and geopolitical fears, US lenders raised US$228.5bn of new loan assets in 2Q25, a 29% jump compared to the year ago period, to push 1H25 totals to nearly US$407bn (compared to less than US$ 358bn raised in 1H24). About 46% of the incremental dollars raised during the quarter backed acquisition events. At US$106bn, 2Q25 M&A loan volume represented an over 64% increased compared year ago totals. 1H25 results were up over 9% year over year at US$170bn. Investment grade M&A lending was up nearly three times quarter over quarter and 62% year over year at US$29.5bn but down 48% for the first six months of the year, at just over US$40bn. In the leveraged space, the story was more complicated. Over US$70bn in leveraged M&A was completed in 2Q25, a jump of nearly 67% compared to the same time last year. At US$117.5bn 1H25 leveraged M&A loan volume was up 65%. There were caveats to the strong numbers however. At less than US$12bn, 2Q25 LBO volume was down over 51% year over year and 1H25 totals were off 31% at US$25.5bn. Leveraged lenders noted that much of the 2Q25 calendar reflected deals that were already in the pipeline. While they got done quickly and were well received, any building M&A calendar remained light.




Latest news

US leveraged loans returns turn negative in October
The Bloomberg US Leveraged Loan Index (Ticker: LOAN) has returned -0.26% this month through October 21, reducing its year-to-date return…

M&A activity begins to tick upward
In the third quarter of 2026, acquisition-linked loan volume across North America and Europe reached about $47 billion, up from $30.6 billion in Q2 and $29.5 billion a year ago.
