



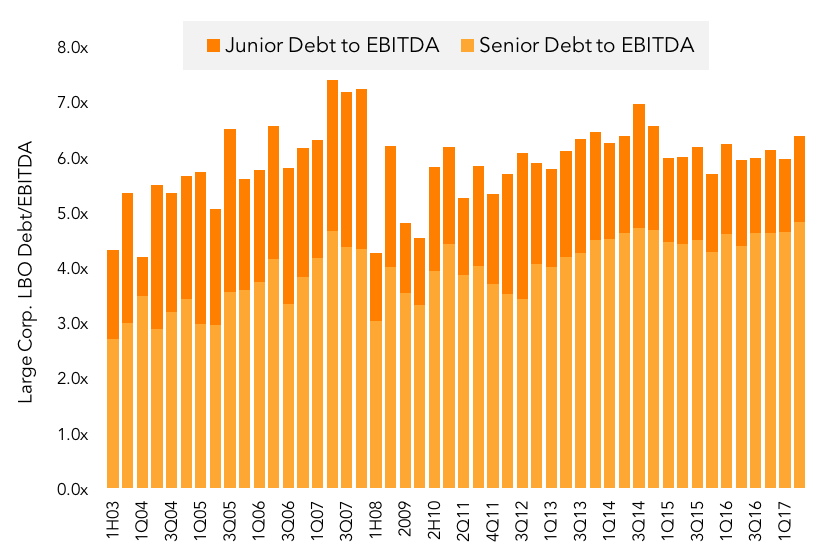
Leverage levels on large corporate LBO deals closed in 2Q17 has reached the highest level tracked since 4Q14. Leverage averaged roughly 4.84 times first lien by 6.39 times total debt to EBITDA this quarter for broadly syndicated LBO deals, up from 4.65 times first lien by 5.98 times total debt to EBITDA in 1Q17. Post credit crisis, large corp. LBO leverage peaked in 3Q14 at nearly 7 times before being reigned in due to Leveraged Lending Guidance. However, given a supply demand imbalance and extremely competitive market conditions, arrangers have pushed LBO structures this quarter resulting in leverage climbing 0.4 turns. Furthermore, banks are closely watching regulatory developments that could potentially loosen restrictions with regards to Leveraged Lending Guidance and Dodd Frank. While banks are very much trying to abide by the guidance, the strength of the market has resulted in some aggressive deals. In 1H17, roughly one in three large corporate buyouts were levered at seven times or greater, up from 28% in 2016 and only 13% in 2015. Deals were also more expensive this quarter, another driver of higher leverage. The average purchase price multiple on large corporate buyouts rose to 10.6 times in 2Q17, up from 9.9 times in 1Q17.
Contact: Fran Beyers
frances.beyers@tr.com



Latest news

Top 50 BDCs Accounted for 75% of Nonaccrual Loan Cost in Q2’26
The 50 largest BDCs, on the basis of total debt investments as of the second quarter of 2026, accounted for 75% of the total aggregate reported value of nonaccrual debt at cost and fair value.

US private debt AUM ($B) by channel
In 2025 and the early part of 2026, the retail channel added AUM to the asset class at a much faster rate than institutional investors in both regions, with growth rates of 43.7% globally, 41.4% in the US, and 73. 1% in Europe through the beginning of 2026 compared with year-end 2024 figures.
