



The institutional pipeline has ballooned in recent weeks on the back of several sizeable M&A deals. Last week, the calendar reached almost $80 billion, which is the highest level since February 2013. The driver of the jump is mostly two jumbo sized M&A deals for Charter Communications and Avago Technologies. Together, those two institutional deals make up almost 40% of the calendar. Strategics have been dominating M&A activity this year given hoards of cash, strong equity valuations and long term time frames to allow for synergies.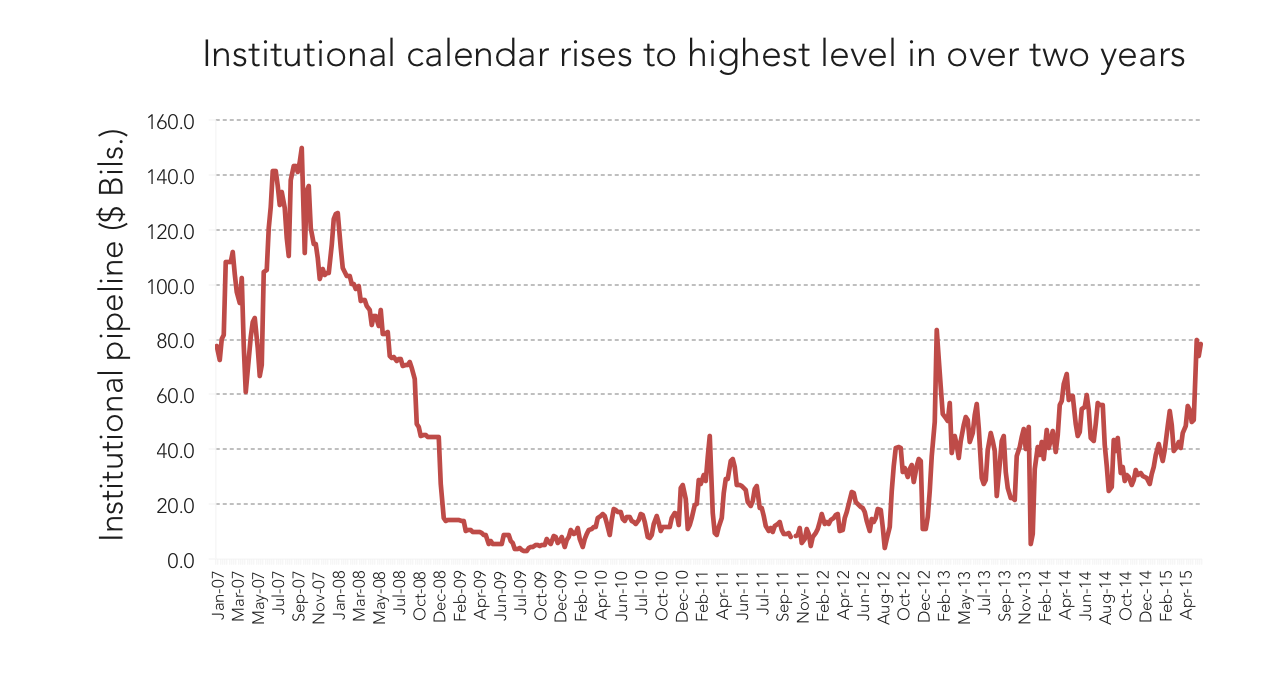 Lenders believe this trend will continue for the remainder of 2015, while private equity funds will continue to struggle to compete with corporates. LBO volume showed another light quarter in 2Q15. After only reaching $19 billion in 1Q15, volume stayed flat so far in 2Q15 at around $18.7 billion. Furthermore, volume has remained low because most of the activity continues to occur in the middle market, which is outpacing large corporate two to one. Further boosting the institutional pipeline has been strong refinancing activity. After plummeting to only $8.6 billlion in 1Q15, completed institutional refinancing volume skyrocketed in 2Q15 to $96 billion.
Contact: Fran Beyers
frances.beyers@thomsonreuters.com



Latest news

Top 50 BDCs Accounted for 75% of Nonaccrual Loan Cost in Q2’26
The 50 largest BDCs, on the basis of total debt investments as of the second quarter of 2026, accounted for 75% of the total aggregate reported value of nonaccrual debt at cost and fair value.

US private debt AUM ($B) by channel
In 2025 and the early part of 2026, the retail channel added AUM to the asset class at a much faster rate than institutional investors in both regions, with growth rates of 43.7% globally, 41.4% in the US, and 73. 1% in Europe through the beginning of 2026 compared with year-end 2024 figures.
