


2Q18 US M&A loan volume sets quarterly record; 1H18 total also at historical high

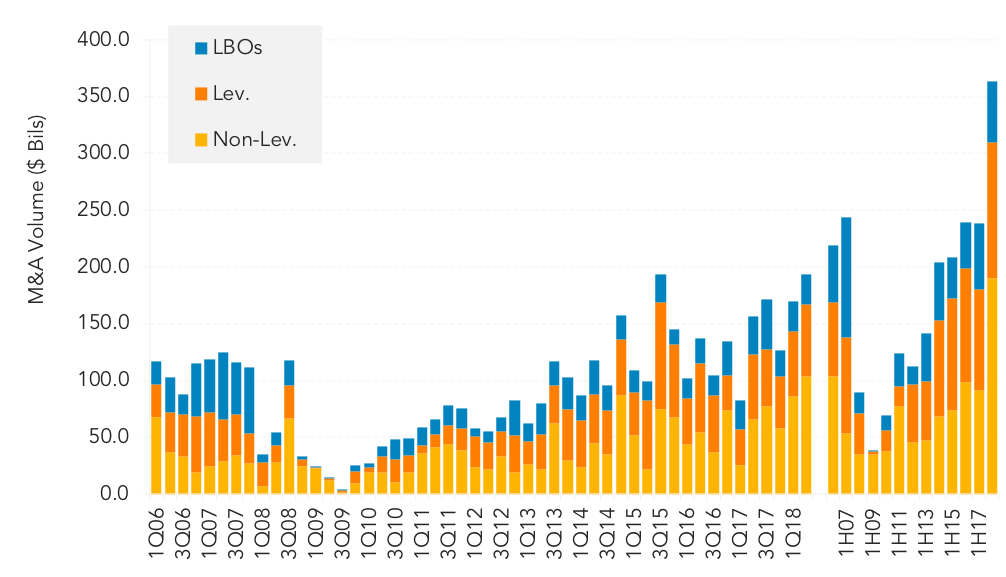
The US market cleared almost US$194bn in acquisition loan financing in 2Q18 via a series of jumbo deals, to set a new quarterly record. In turn, 1H18 M&A volume at US$363.5bn marked a record high for any half year period. At over US$103bn, 2Q18 non-leveraged M&A deal flow topped previous quarterly totals to record a historic quarterly high and boosting 1H18 volumes to a record setting US$190bn or 52% of total M&A volume so far this year. Leveraged corporates were also actively engaged in the M&A space, raising over US$120bn in 1H18, a high watermark for the first six months of any year. PE sponsors were well positioned to tap lenders amid a market perception of a softening regulatory stance on Leveraged Lending Guidance. In the process, they raised US$53.5bn in buyout financing in 1H18.
Contact: Maria Dikeos
maria.dikeos@thomsonreuters.com



Latest news

US Leveraged Loans Return 3.36% to Investors YTD
The Bloomberg US Leveraged Loan Index (Ticker: LOAN) returned 0.96% in August and has gained an additional 0.28% through September…

PE dry powder
The capital that is being raised is flowing overwhelmingly to the largest, most established managers.

Middle market debt held by BDCs vs High yield vs Treasury yields
The blue line represents the current dividend yield of the VanEck BDC Income ETF (BIZD), which stood at 11.7% as…