


2Q21 M&A loan volume nearly 3 times year ago totals; 1H21 volume two times 1H20 results

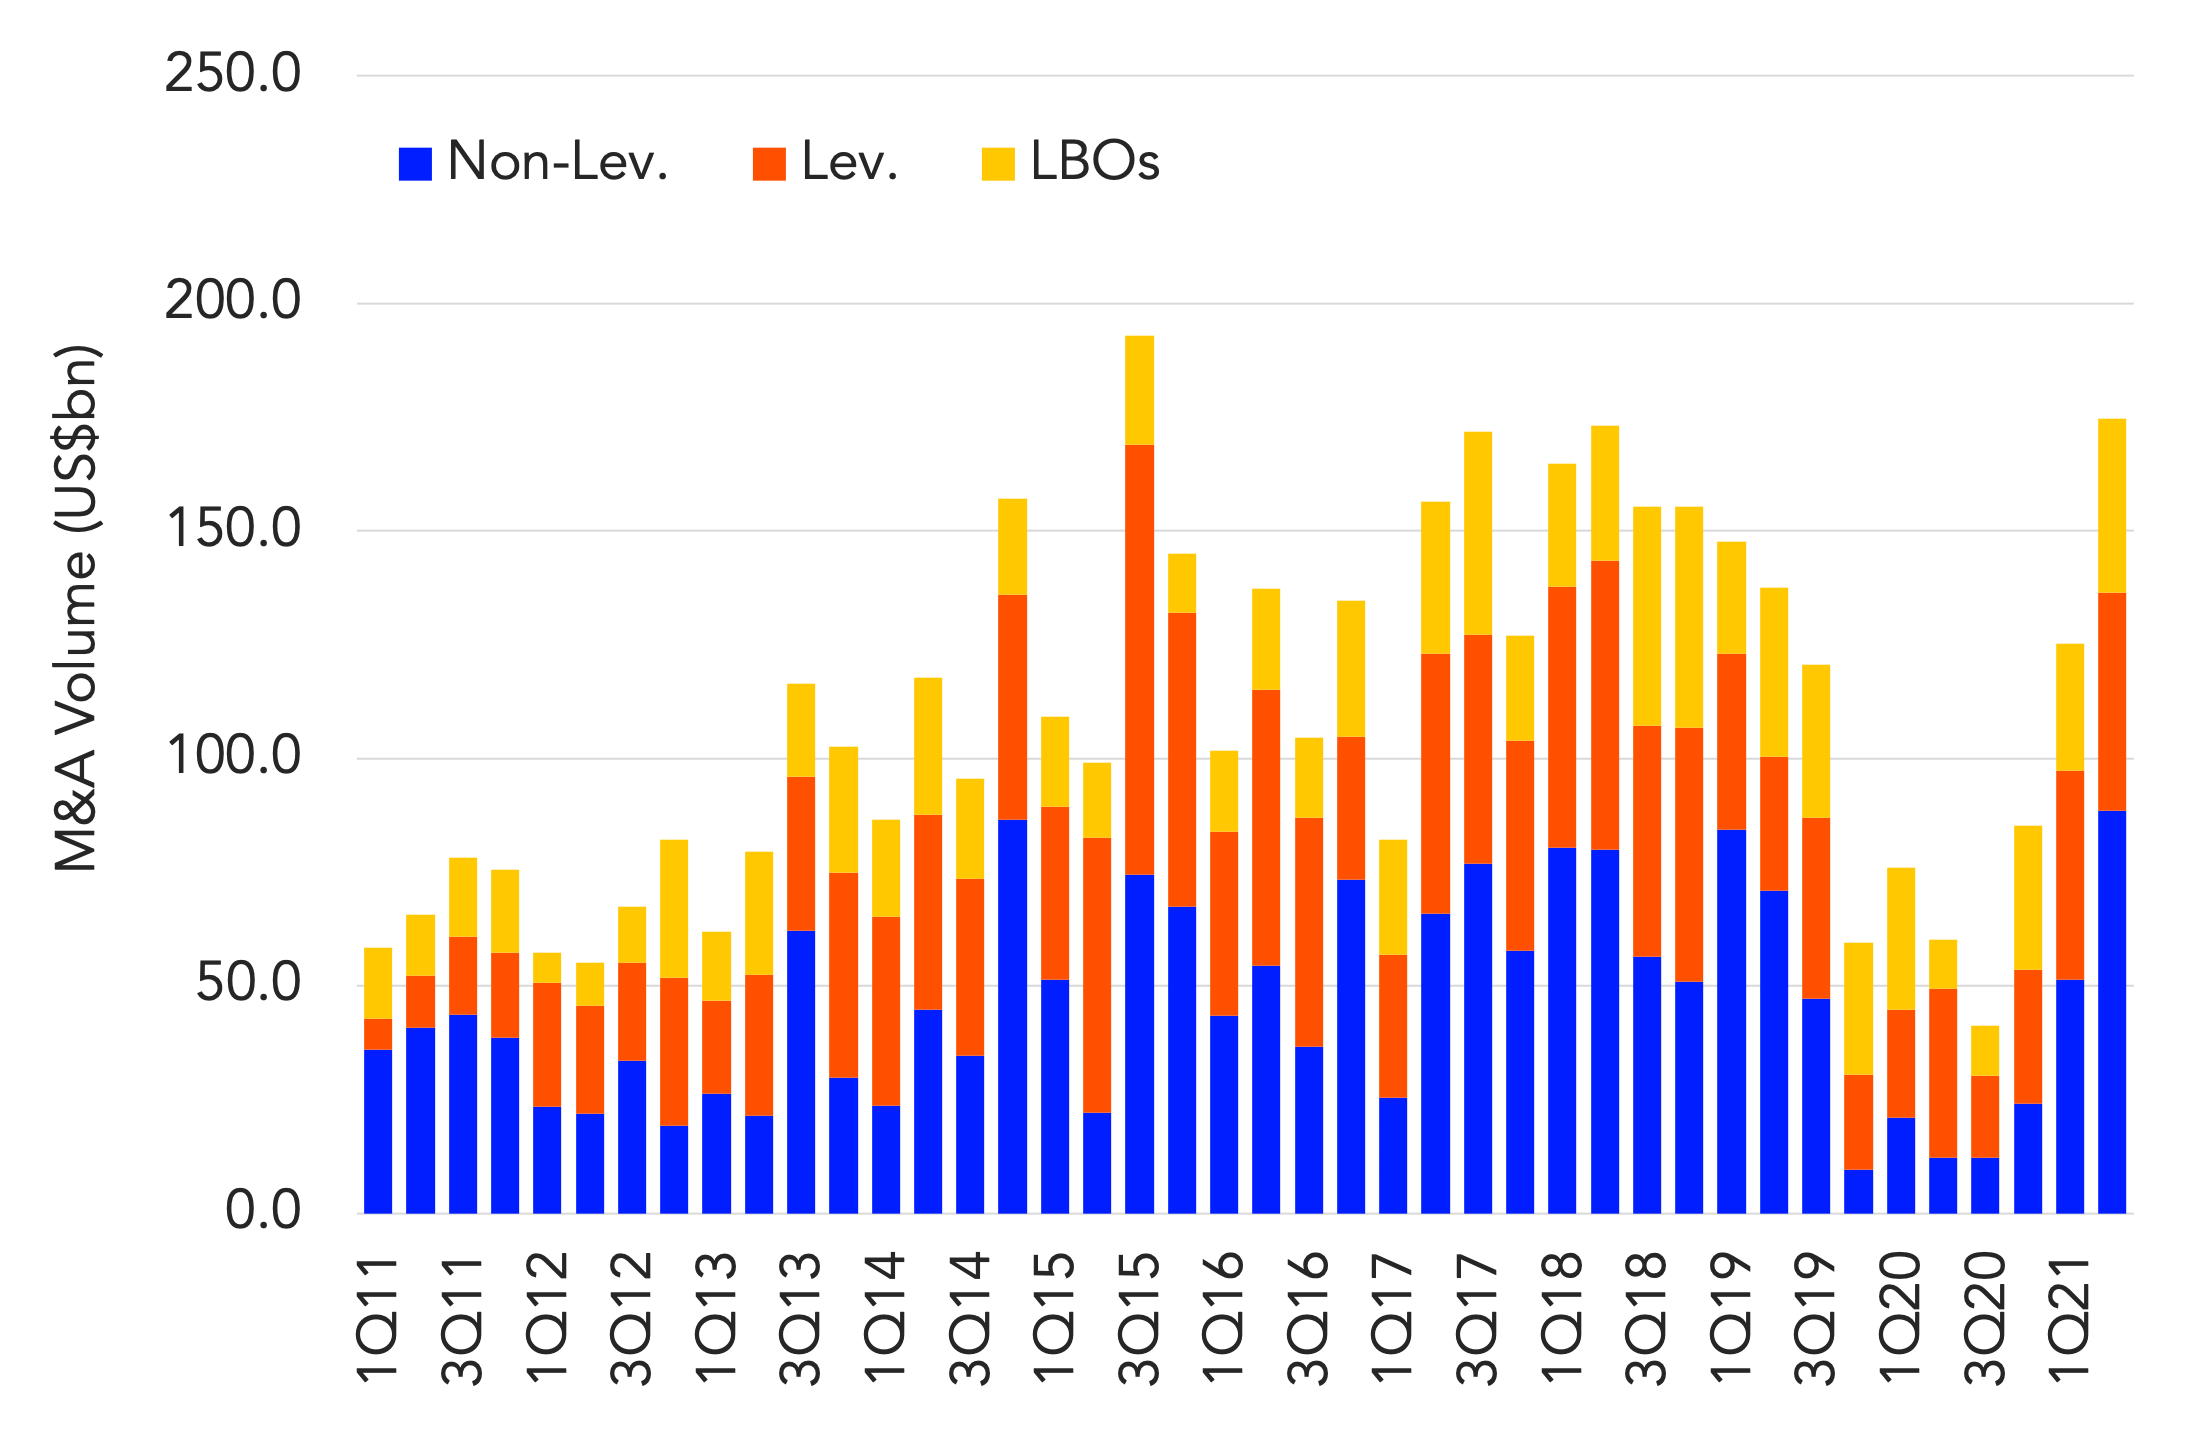
Nearly US$175bn in M&A loan volume was completed in 2Q21, a 40% increase over 1Q21 results and almost three times the comparable year ago totals. The market completed almost US$300bn in M&A loan volume during the first six months of 2021, over two times year ago levels and the highest half year total in three years.
At US$88.5bn, 2Q21 non-leveraged M&A loan issuance jumped 72% quarter over quarter and was up over seven times compared to the US$12.2bn raised in 2Q20. Arrangers noted that in contrast to the steady pace of high grade M&A deals announced in 1Q21, the investment grade pipeline seemed to slow a little bit in 2Q21. Just under US$42bn of investment grade M&A loan volume cleared the market in 2Q21, down modestly from the over US$45bn raised in 1Q21.
Despite the modestly slower calendar, lenders note that liquidity nevertheless remains firmly in place to support large transactions. At the lower end of the credit spectrum, both leveraged corporate and PE backed acquisition loans saw an increase in 2Q at US$48bn and US$38bn respectively. 2Q21 LBO issuance alone was up nearly 38% quarter over quarter and over 3.5 times year ago totals to mark the strongest quarterly results since 4Q18. More significantly, at US$66bn, 1H21 LBO loan volume represents the strongest six month start to the calendar since 1H07.



Latest news

Top 50 BDCs Accounted for 75% of Nonaccrual Loan Cost in Q2’26
The 50 largest BDCs, on the basis of total debt investments as of the second quarter of 2026, accounted for 75% of the total aggregate reported value of nonaccrual debt at cost and fair value.

US private debt AUM ($B) by channel
In 2025 and the early part of 2026, the retail channel added AUM to the asset class at a much faster rate than institutional investors in both regions, with growth rates of 43.7% globally, 41.4% in the US, and 73. 1% in Europe through the beginning of 2026 compared with year-end 2024 figures.
