



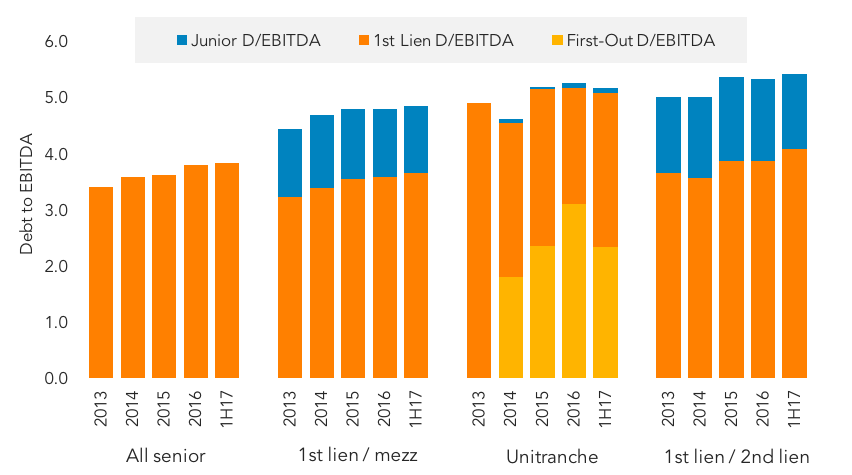
With market conditions extremely heated, leverage levels have peaked across most capital structures in the middle market in 1H17. The “all senior” capital structure hit a new peak at 3.83 times in 1H17, up from 3.79 times last year and from 3.41 times back in 2013 when tracking began. Banks that are hampered by Leveraged Lending Guidance while trying to stay competitive with the direct lenders are the big driver to rising leverage levels on the “all senior structure.” The first lien / mezz structure is also at a peak of 3.65 times senior by 4.84 times total debt to EBITDA, up from 3.22 times by 4.43 times back in 2013. Leverage of nearly 5 times on mezzanine deals is pretty aggressive considering the structure is more commonly seen on lower middle market issuers. Naturally the first lien/second lien structure is the highest and most levered of all structures hitting a new peak in 1H17 of 4.08 times senior by 5.41 times total debt to EBITDA. This level is elevated compared to 2013 levels of just 3.66 times by 5.01 times. The second lien structure is most commonly seen on larger issuers with EBITDA of $40M and above and the institutional market has been buying a lot of this paper in 2017, driving leverage levels to new heights amid strong demand for higher yields. Unitranche leverage, while not at the peak levels tracked in 2016, is still elevated at 5.17 times in 1H17 as unitranche providers try to voraciously compete with the second lien structure. So far in 2H17, pressure on leverage has not abated as middle market lenders feel competitive conditions remain.
Contact: Fran Beyers
frances.beyers@tr.com



Latest news

US Leveraged Loans Return 3.36% to Investors YTD
The Bloomberg US Leveraged Loan Index (Ticker: LOAN) returned 0.96% in August and has gained an additional 0.28% through September…

PE dry powder
The capital that is being raised is flowing overwhelmingly to the largest, most established managers.

Middle market debt held by BDCs vs High yield vs Treasury yields
The blue line represents the current dividend yield of the VanEck BDC Income ETF (BIZD), which stood at 11.7% as…