



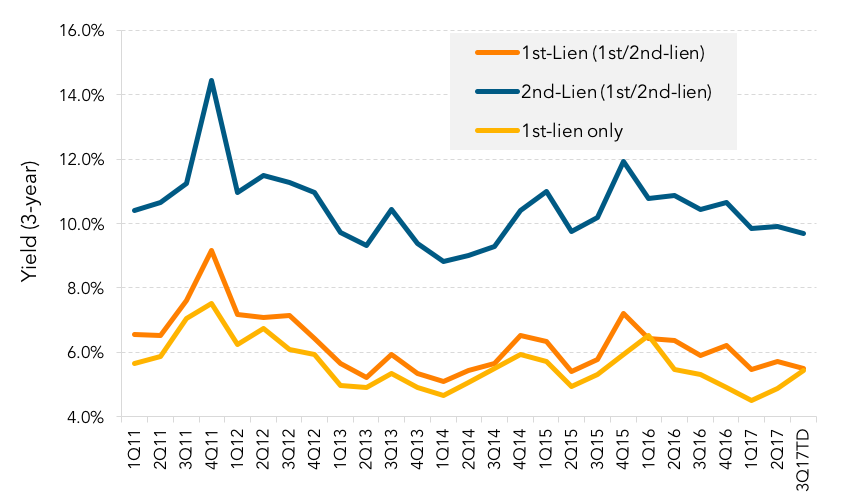
The average yield has widened to 5.46% so far in 3Q17 from 4.96% in 2Q17. One of the reasons behind widening yields is that while refinancings continue to lead activity, the share of M&A credits has increased to 40% of the institutional tranches priced so far this quarter. This is much higher than the 28% recorded in 2Q17. While first-lien yields have increased, yields on first-lien/second-lien structures have tightened, but continue to provide a hefty premium on the second-lien piece. The average yield, assuming a three-year term to repayment on second-lien term loans is 9.70% so far this quarter; roughly 20bp lower than 2Q17 levels. Yields on first-lien term loans that are part of a first/second-lien structure currently stand at an average of 5.50%, down from 5.72% in 2Q17. In turn, second-lien term loans provide a yield premium of 420bp compared to their first-lien counterparts when part of a bifurcated structure; a tad higher than the 418bp recorded in 2Q17. Meanwhile, yields on standalone first-lien yields have widened to 5.45%, their highest level in over a year. In turn, the premium between first-lien term loans that are part of a first/second lien structure and stand-alone first-lien term loans is currently almost non-existent at 0.05%.
Contact: Diana Diquez
diana.diquez@tr.com



Latest news

Top 50 BDCs Accounted for 75% of Nonaccrual Loan Cost in Q2’26
The 50 largest BDCs, on the basis of total debt investments as of the second quarter of 2026, accounted for 75% of the total aggregate reported value of nonaccrual debt at cost and fair value.

US private debt AUM ($B) by channel
In 2025 and the early part of 2026, the retail channel added AUM to the asset class at a much faster rate than institutional investors in both regions, with growth rates of 43.7% globally, 41.4% in the US, and 73. 1% in Europe through the beginning of 2026 compared with year-end 2024 figures.
