



Flex activity continued to favor issuers in July
Market sentiment in July was more of the same in the leveraged institutional market. Although deal flow thinned out from a swell of volume in June, negotiations continued to favor issuers. Thomson Reuters LPC’s Flex Factor scored a -0.04 for July, the fourth straight month in issuer friendly territory. The Flex Factor, which aggregates price and structural activity to gauge investor sentiment, saw 14 reverse flexes against just 4 upward flexes. Tightening OID’s were the main driver of reverse flexes as 8 issuers saw their discounts swing more favorably to go along with 3 spread reverse flexes.
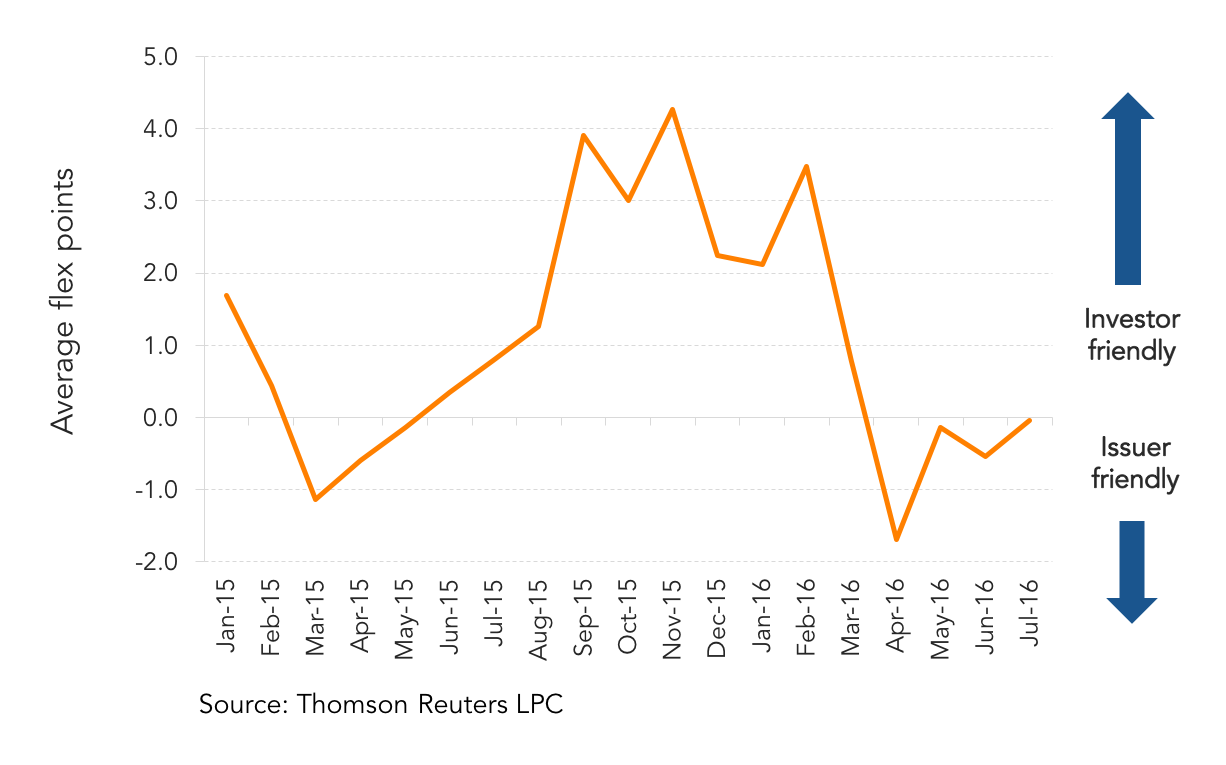 Meanwhile 6 issuers saw commitments increase during negotiations in July. Similar to past months, a few of the upward flexed deals saw significant investor friendly changes to the deal, which helped keep the Flex Factor score nearer to neutral for the month. For instance, Arbor Pharmaceuticals saw the OID on its US$500m term loan B widen out substantially from 99 to 94 earlier in the month. Institutional deal flow tapered in July after hitting a year-to-date peak in June. The institutional pipeline topped out at US$33bn last month after getting as high as US$49bn in June.



Latest news

Top 50 BDCs Accounted for 75% of Nonaccrual Loan Cost in Q2’26
The 50 largest BDCs, on the basis of total debt investments as of the second quarter of 2026, accounted for 75% of the total aggregate reported value of nonaccrual debt at cost and fair value.

US private debt AUM ($B) by channel
In 2025 and the early part of 2026, the retail channel added AUM to the asset class at a much faster rate than institutional investors in both regions, with growth rates of 43.7% globally, 41.4% in the US, and 73. 1% in Europe through the beginning of 2026 compared with year-end 2024 figures.
