



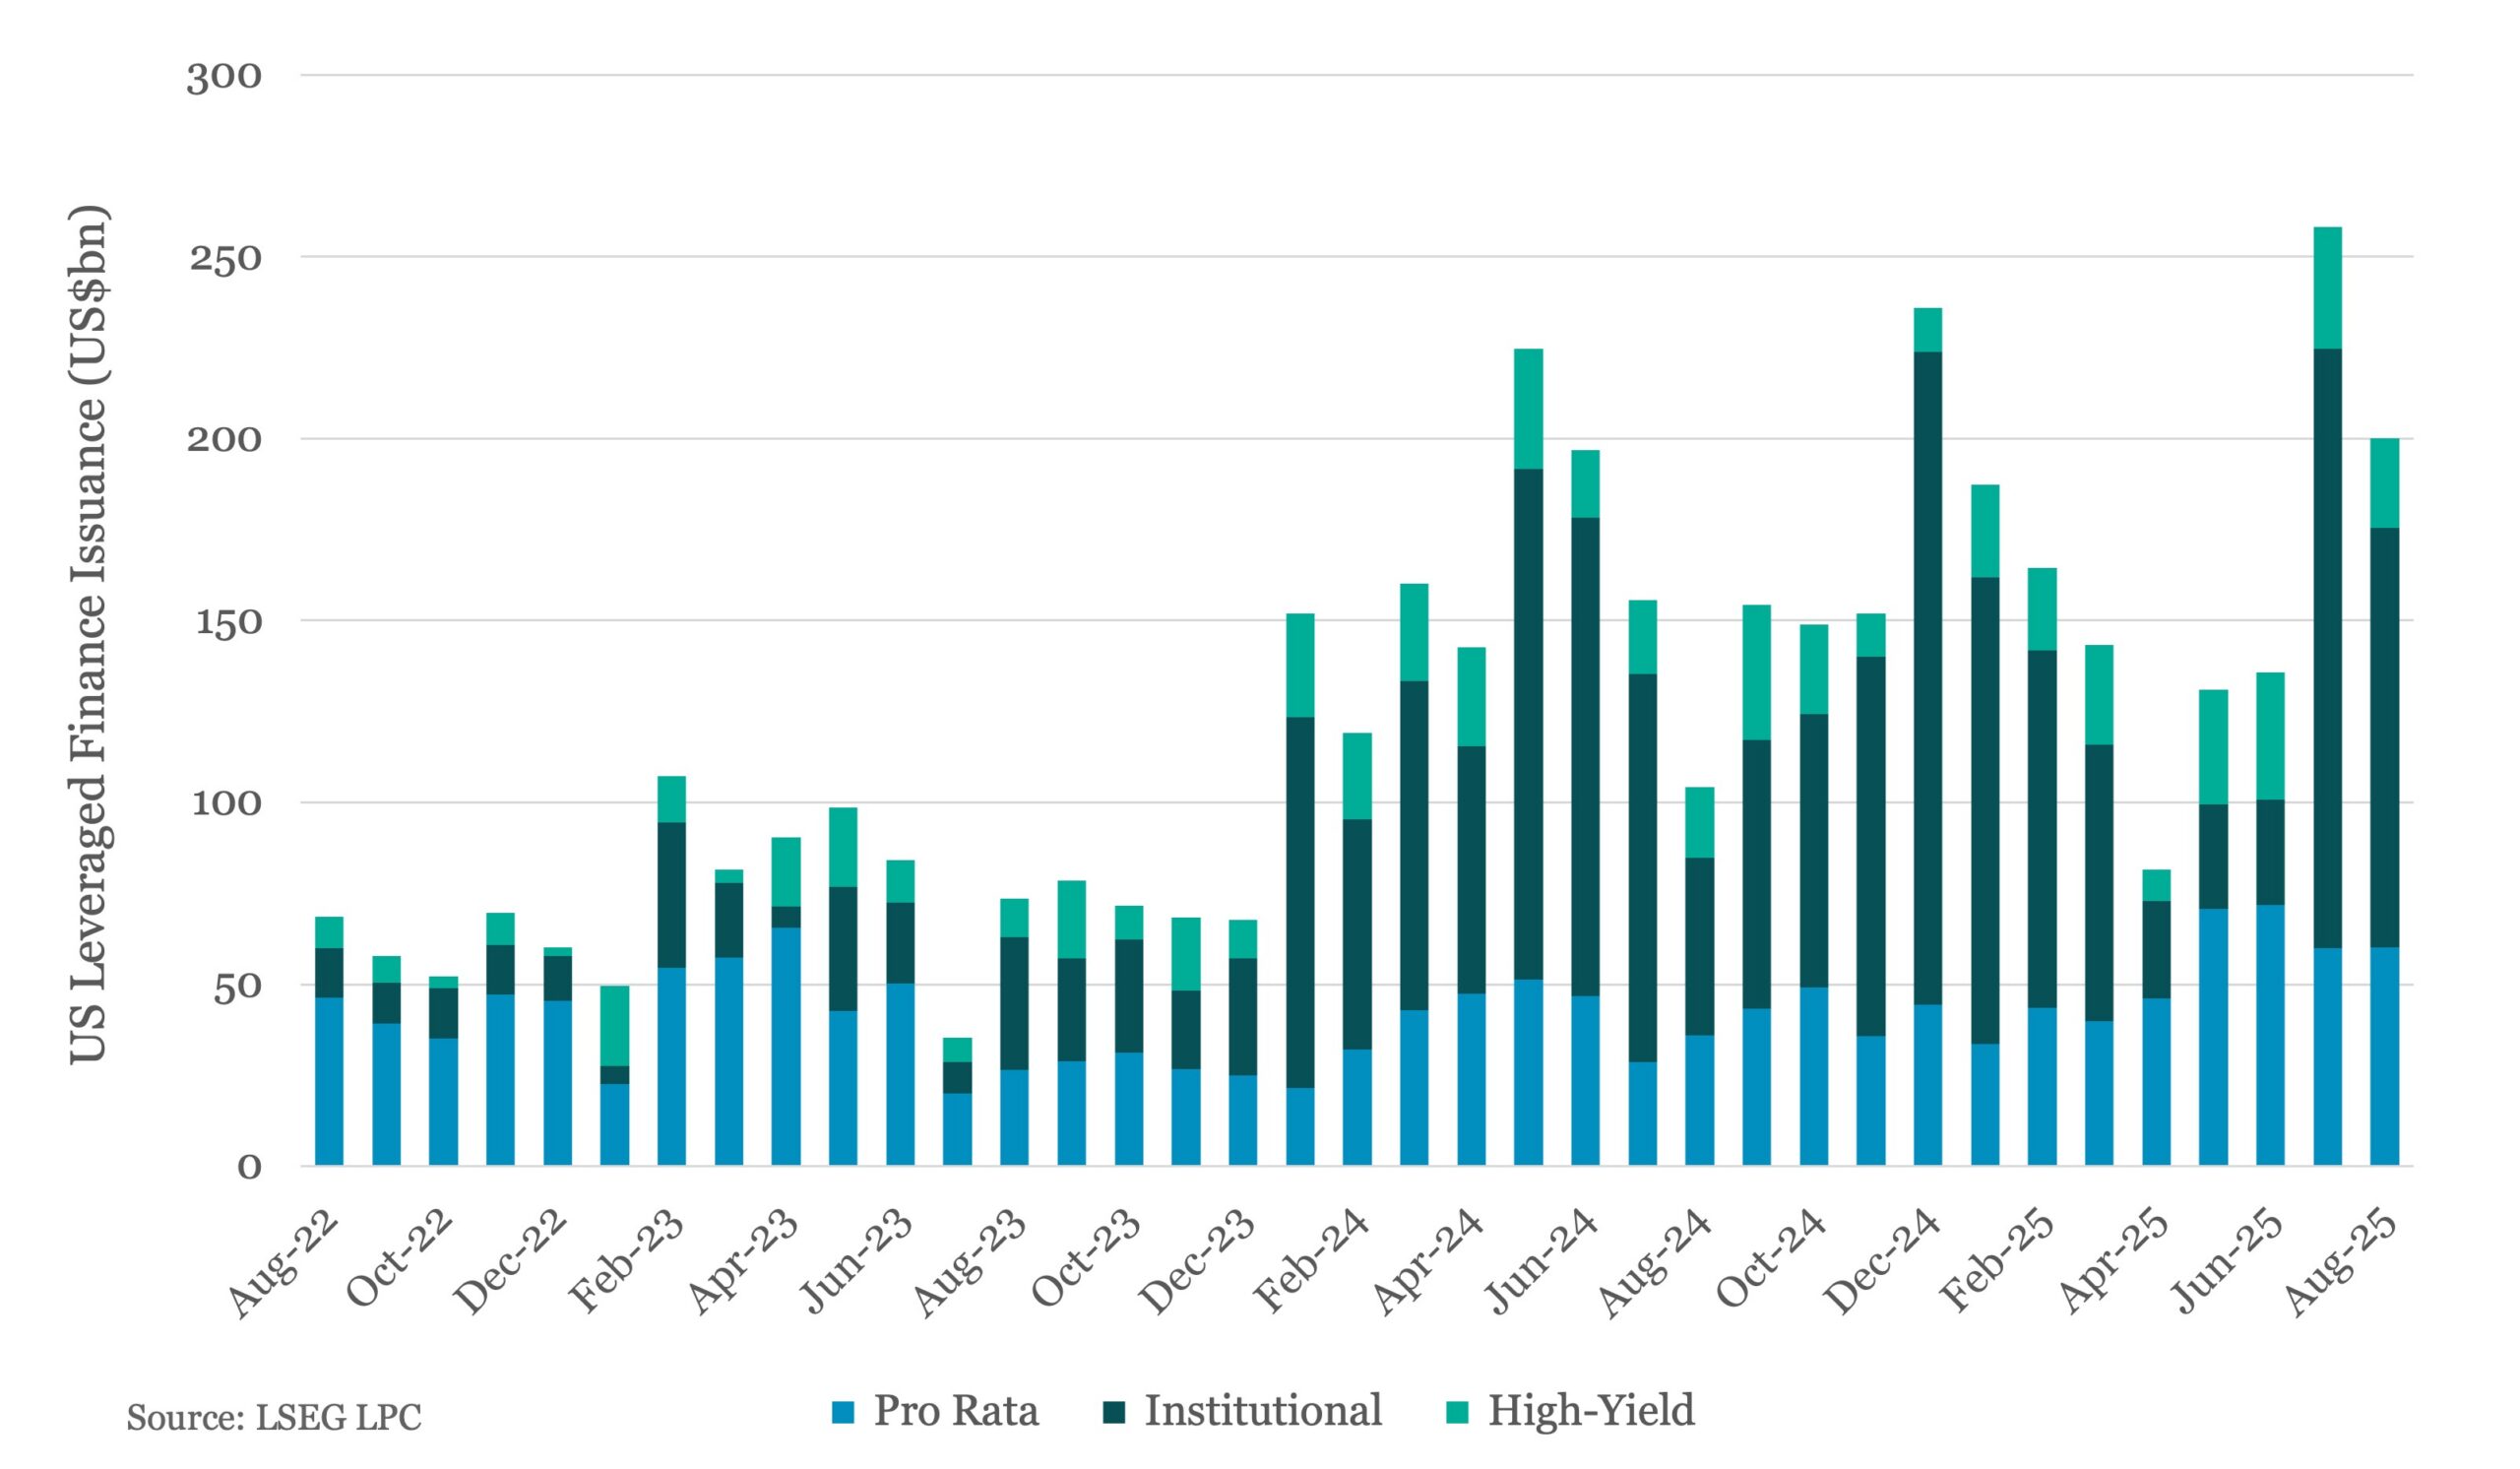
For US LevFin, we saw trends of previous months continue to play out in August: (1) Defense over offense, with issuers largely focused on managing liabilities versus making acquisitions; (2) Strategic M&A driving the majority of underwritings; (3) Rate-sensitive LBO trades struggling to catch bids on valuations; (4) High-yield bond issuance holding somewhat steady despite minimal (if any) contribution from AcqFin. Leveraged loan issuance slipped more than 20% on the month to US$175bn, although August was historically active given dealmaking tends to average about US$75bn at this slower time of year. Refinancings drove approximately 75% of the leveraged loan business, with institutional loan repricings accounting for nearly 40% of issuance within that cohort. Institutional new money issuance marginally slipped to US$22.5bn, with strategic M&A driving more than 50% or US$11.6bn, while LBO financings reached nearly 18% or US$4.0bn. High-yield bond issuance totaled US$24.5bn across 25 executions (roughly US$1bn average issuance size) with zero contribution from AcqFin. Year-to-date, US leveraged loan issuance comes to approximately US$1.1trn – or more than US$1.3trn including high-yield bonds – with both figures up marginally from the same period last year. More importantly, leveraged M&A underwrites are up more than 80% year-over-year (US$184bn in ’25 versus US$102bn in ’24). We therefore reiterate our guidance that lender P&Ls should be trending significantly higher relative to last year given this greater contribution from overall M&A, especially among the more active underwriters.



Latest news

US Leveraged Loans Return 3.36% to Investors YTD
The Bloomberg US Leveraged Loan Index (Ticker: LOAN) returned 0.96% in August and has gained an additional 0.28% through September…

PE dry powder
The capital that is being raised is flowing overwhelmingly to the largest, most established managers.

Middle market debt held by BDCs vs High yield vs Treasury yields
The blue line represents the current dividend yield of the VanEck BDC Income ETF (BIZD), which stood at 11.7% as…