



Volatility returned to the loan market in 3Q15 to contribute to a deeper and more sustained summer slowdown which saw just over $401billion of issuance work its way through syndication. This marked a decline of nearly 29 percent compared to 2Q15 figures and an 11 percent drop compared to the year ago period. Similarly, at less than $1.4 trillion, 1-3Q15 loan volume was down 12 percent compared to the year ago period to mark the lowest total for the first nine months of a year since 2012. At $204 billion, 3Q15 investment grade volume was up roughly 6 percent on the back of a solid M&A pipeline set in motion earlier in the year.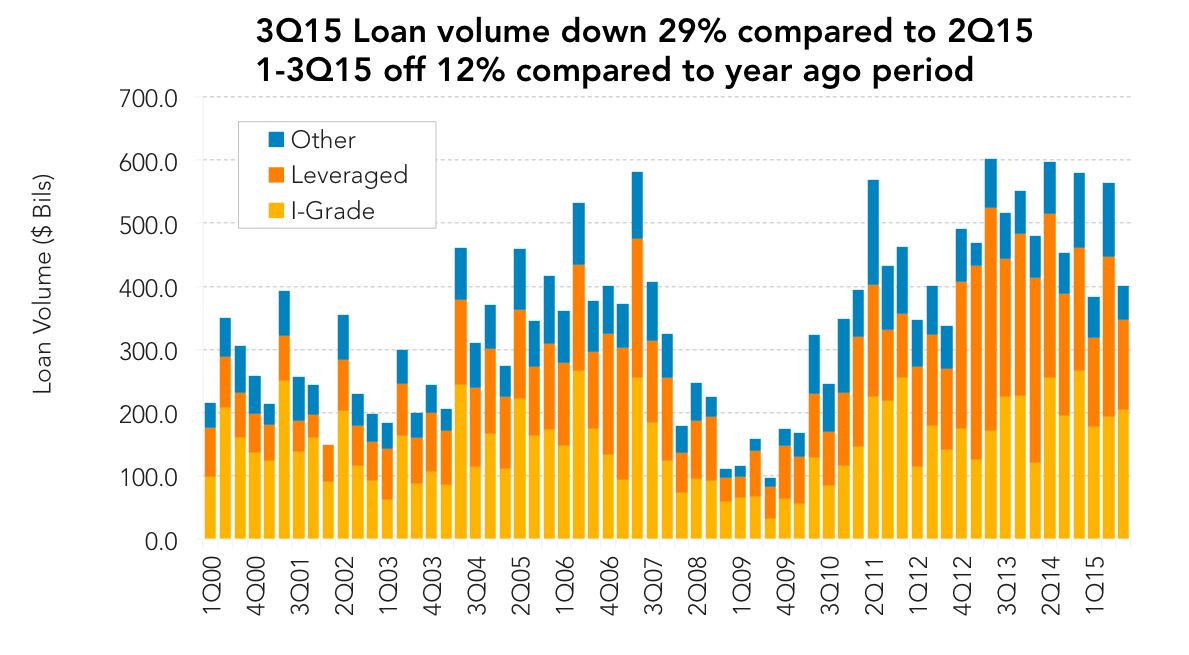 Nearly $69 billion or about 34 percent of 3Q15 volume represented new loan assets, up from less than $40 billion last quarter. Investment grade M&A volume specifically, topped $63 billion in 3Q15, bringing 1-3Q15 totals to just over $126 billion. Sources note however, that 3Q15 ushered a slow down, so there is mixed confidence that completed investment grade M&A volume for the year will hit $150 billion. The choppy market had a greater impact on leveraged lending. Sources note that a real bifurcation between the haves and have nots took hold with the haves securing good execution and the have nots getting beaten up in the bond market and avoiding the loan market. The good news was that there was no loan market backup given the limited pipeline. A relatively thin $142 billion of leveraged loan volume cleared the market down over 44 percent from last quarter, bringing 1-3Q15 totals to $537 billion.
Contact: Maria Dikeos
maria.dikeos@thomsonreuters.com




Latest news
Q2'26 BDC analysis shows additional 184 bps of nonaccruals at cost
In a universe of 173 business development companies, or BDCs, Octus identified a total of $9.5 billion of debt (at cost) in nonaccrual status reported in the second quarter of 2026, a slight decline of 5% from $10 billion in the first quarter of 2026.

Reading the Board
The story changes depending on which numbers you’re counting.
Private Credit Defaults 101: Different Numbers, Different Stories
In Season 2 of Billions, Bobby Axelrod takes his lawyer Orrin Bach to an empty Yonkers racetrack in the dead of night.