


Markit Recap – 2/12/2018

iTraxx skew widens amid volatility
Rates and equity markets are now embroiled in a tussle that has upset the pervasive complacency evident at the beginning of the year. Has this affected the credit markets? Naturally. The primary credit indices experienced considerable volatility; perhaps not as newsworthy as the VIX, but notable nonetheless.
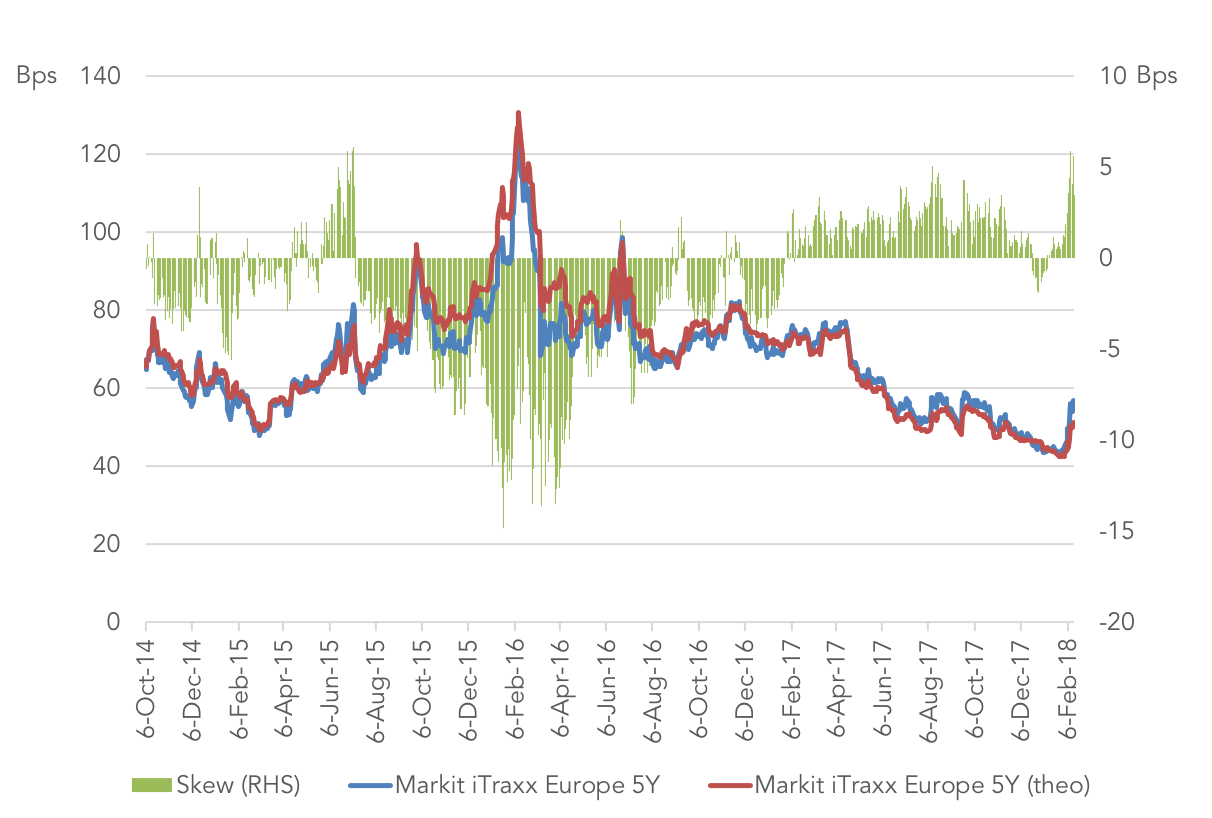
The Markit CDX.NA.IG widened from 45bps to 60bps, a move reminiscent of Q4 2015/Q1 206, when the plummeting oil price sent shockwaves through the US energy sector. The spread elevation in the Markit iTraxx Europe was less pronounced and not on the scale of the 24bps widening seen post-Brexit. But the 10bps move to 57bps was still significant and certainly quashes hopes that the index could dip below 40bps for the first time since 2007.
It’s worth digging a little deeper, though, as the indices don’t always show the full spectrum of activity in the credit markets. One has to also analyse CDS single names, as well as the cash market. All three are inextricably linked but they can have different end-users and therefore different dynamics.
We can see this by looking at the index skew of the Markit iTraxx Europe. The recent 10bps widening in the index was accompanied by a more modest move in the single name constituents, leading to the index reaching a positive skew (basis between the index and theoretical level) of 6bps. This is the highest level since July 2015. Skew accounts positioning for positive basis
Why has the index underperformed so dramatically? There are several possible reasons, but it is hard to discount the different client base for each product. Indices are widely used as macro hedges and for taking directional positions, often by institutions that don’t trade single names. The strong liquidity makes the indices attractive tools for such activity. So when volatility from the rates and equity markets seeps into credit, it typically has a bigger impact on indices compared to single names.
But the skew on the Markit CDX.NA.IG has stayed relatively flat – single names have moved in tandem with the index. This suggests that, in addition to the composition of end-users, there are other factors driving the skew. The presence of financials in the iTraxx Europe often creates divergence with its US counterpart. Banks have widened in recent days, with Deutsche Bank and peripheral names in particular bearing the brunt. The Markit iTraxx Senior Financials was trading tight to the main index, but is now trading slightly wider. The CDS-bond basis is also positive, probably an indication of difficult liquidity conditions in the cash market and the ease of taking short risk positions through CDS.
A recovery of sorts has taken place in recent days, with investors taking the opportunity to add to long risk positions. Some skew accounts are no doubt expecting a reversal in the positive basis. Regardless of the overall market direction, credit investors should be cognisant of the interplay between CDS indices, single names and cash.
Contact: Gavan Nolan
Gavan.Nolan@ihsmarkit.com



Latest news

US Leveraged Loans Return 3.36% to Investors YTD
The Bloomberg US Leveraged Loan Index (Ticker: LOAN) returned 0.96% in August and has gained an additional 0.28% through September…

PE dry powder
The capital that is being raised is flowing overwhelmingly to the largest, most established managers.

Middle market debt held by BDCs vs High yield vs Treasury yields
The blue line represents the current dividend yield of the VanEck BDC Income ETF (BIZD), which stood at 11.7% as…