



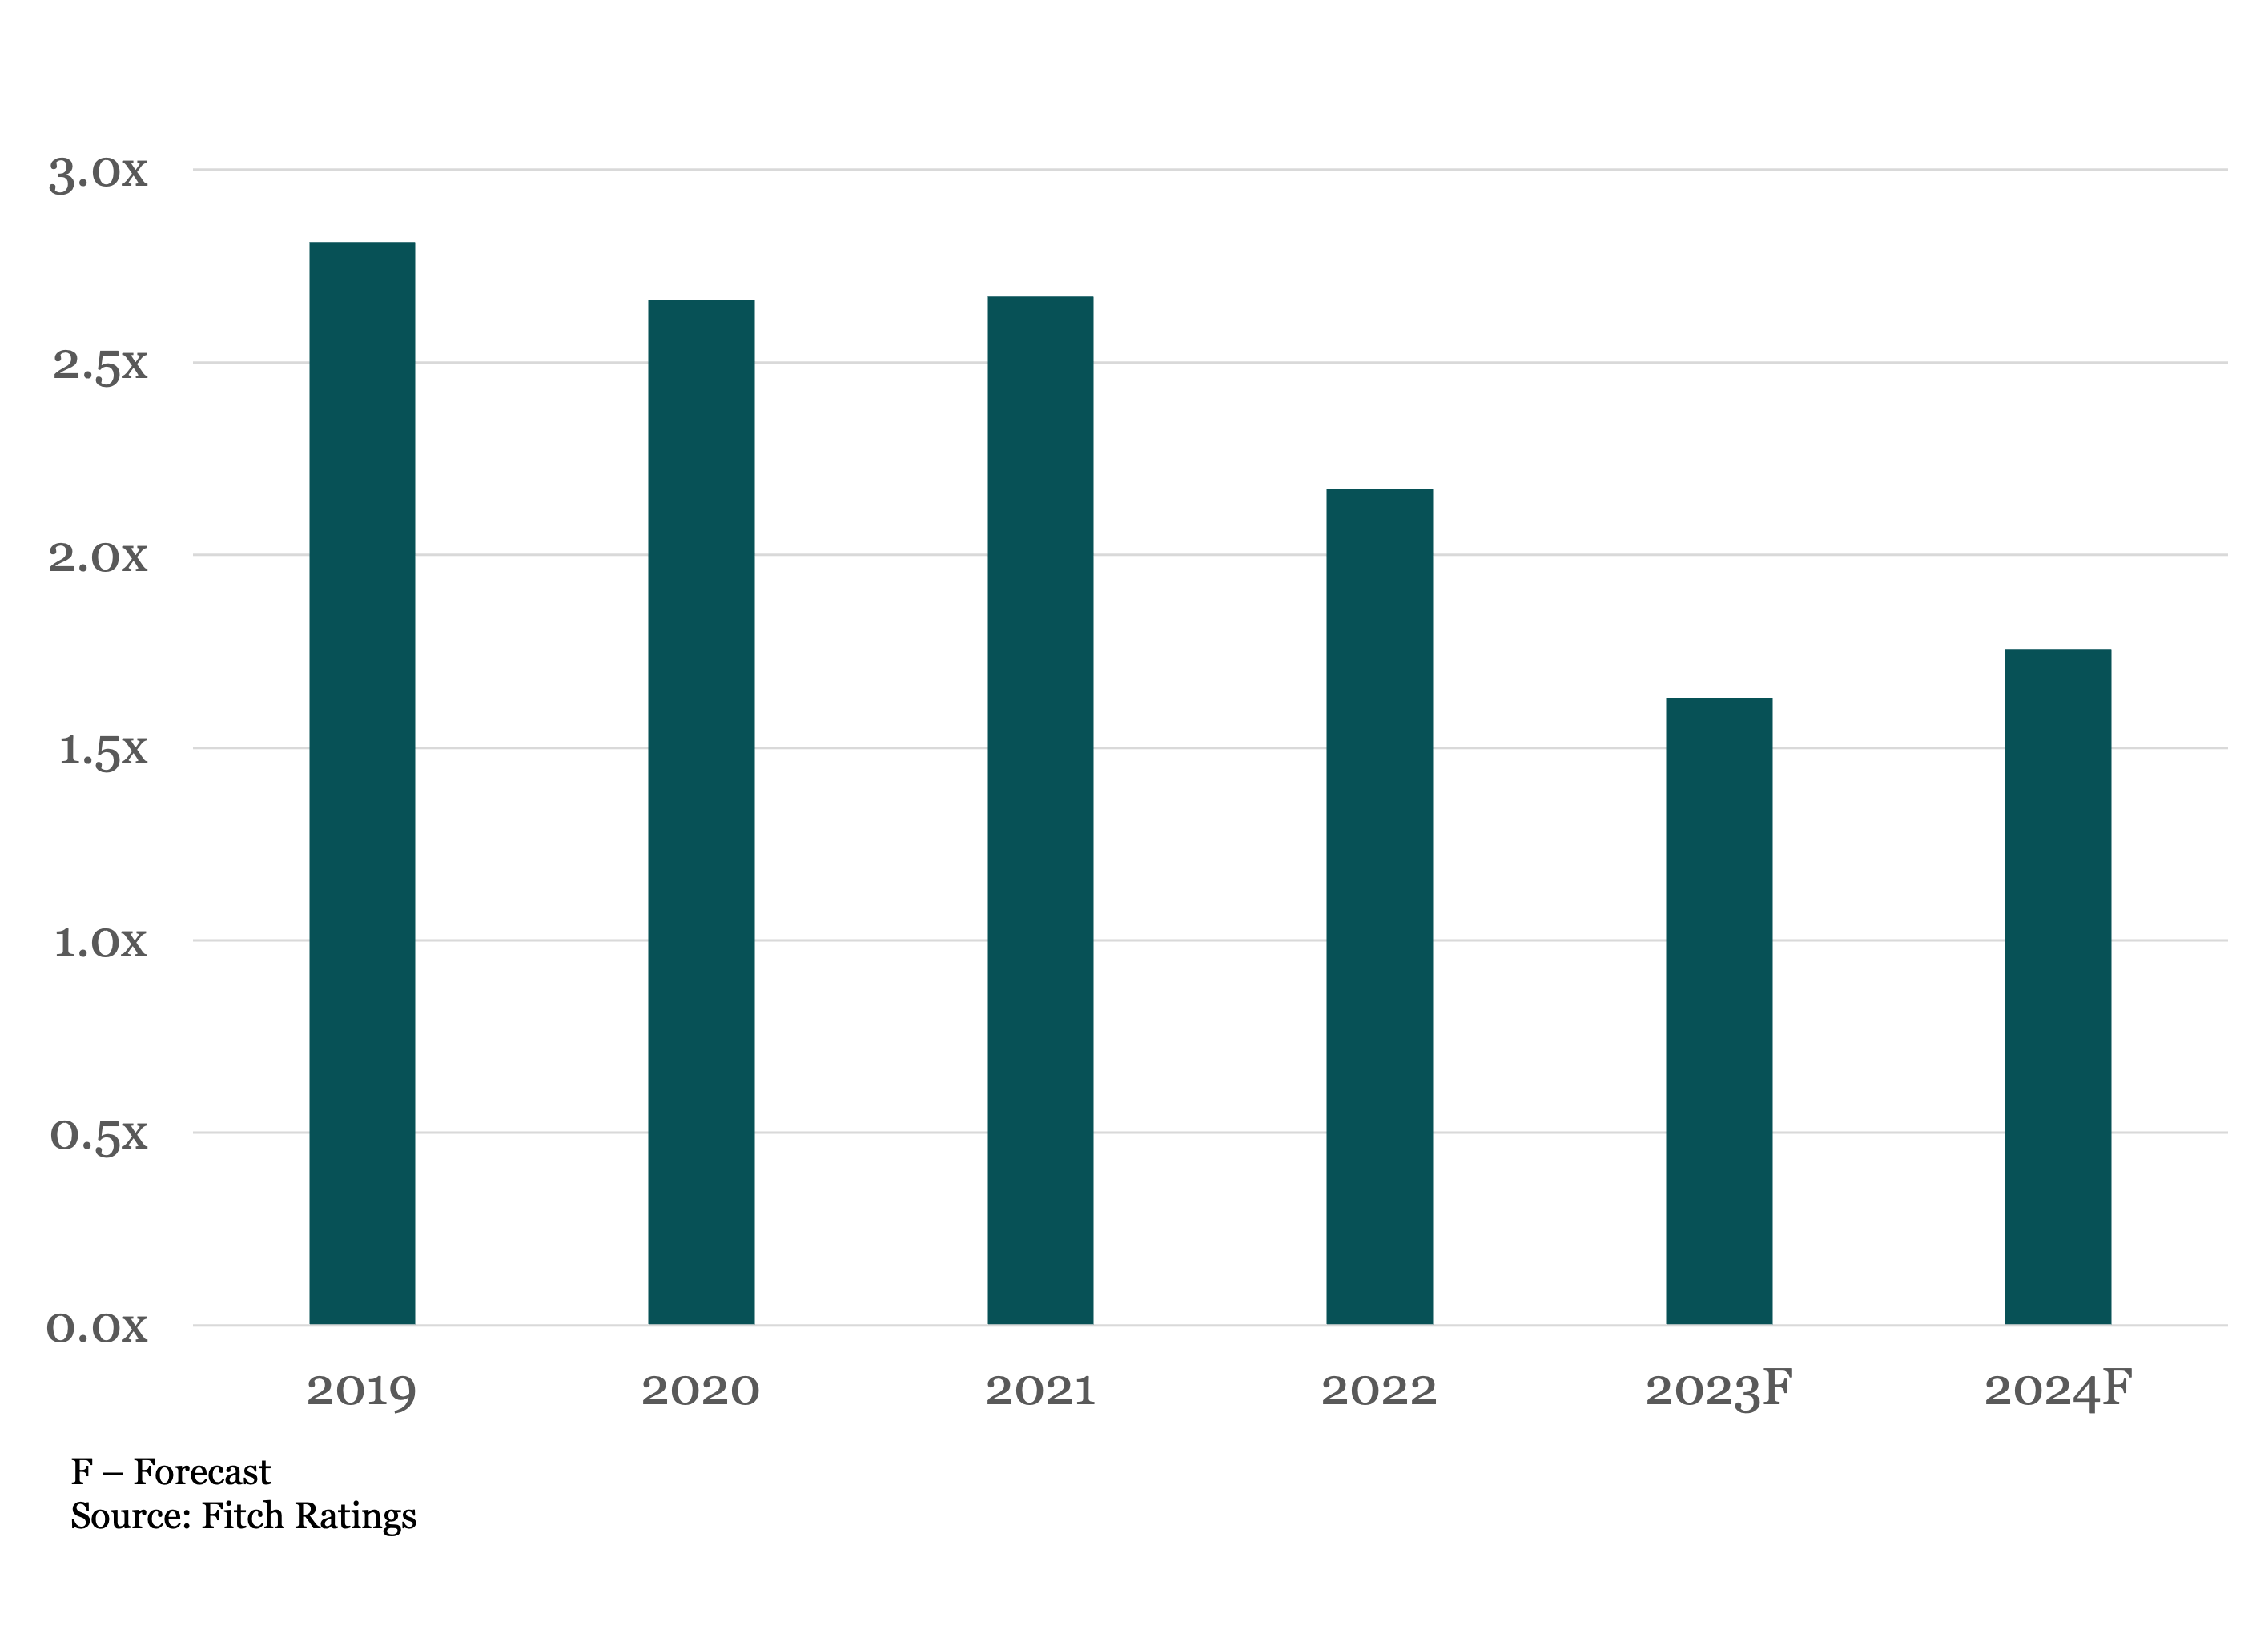
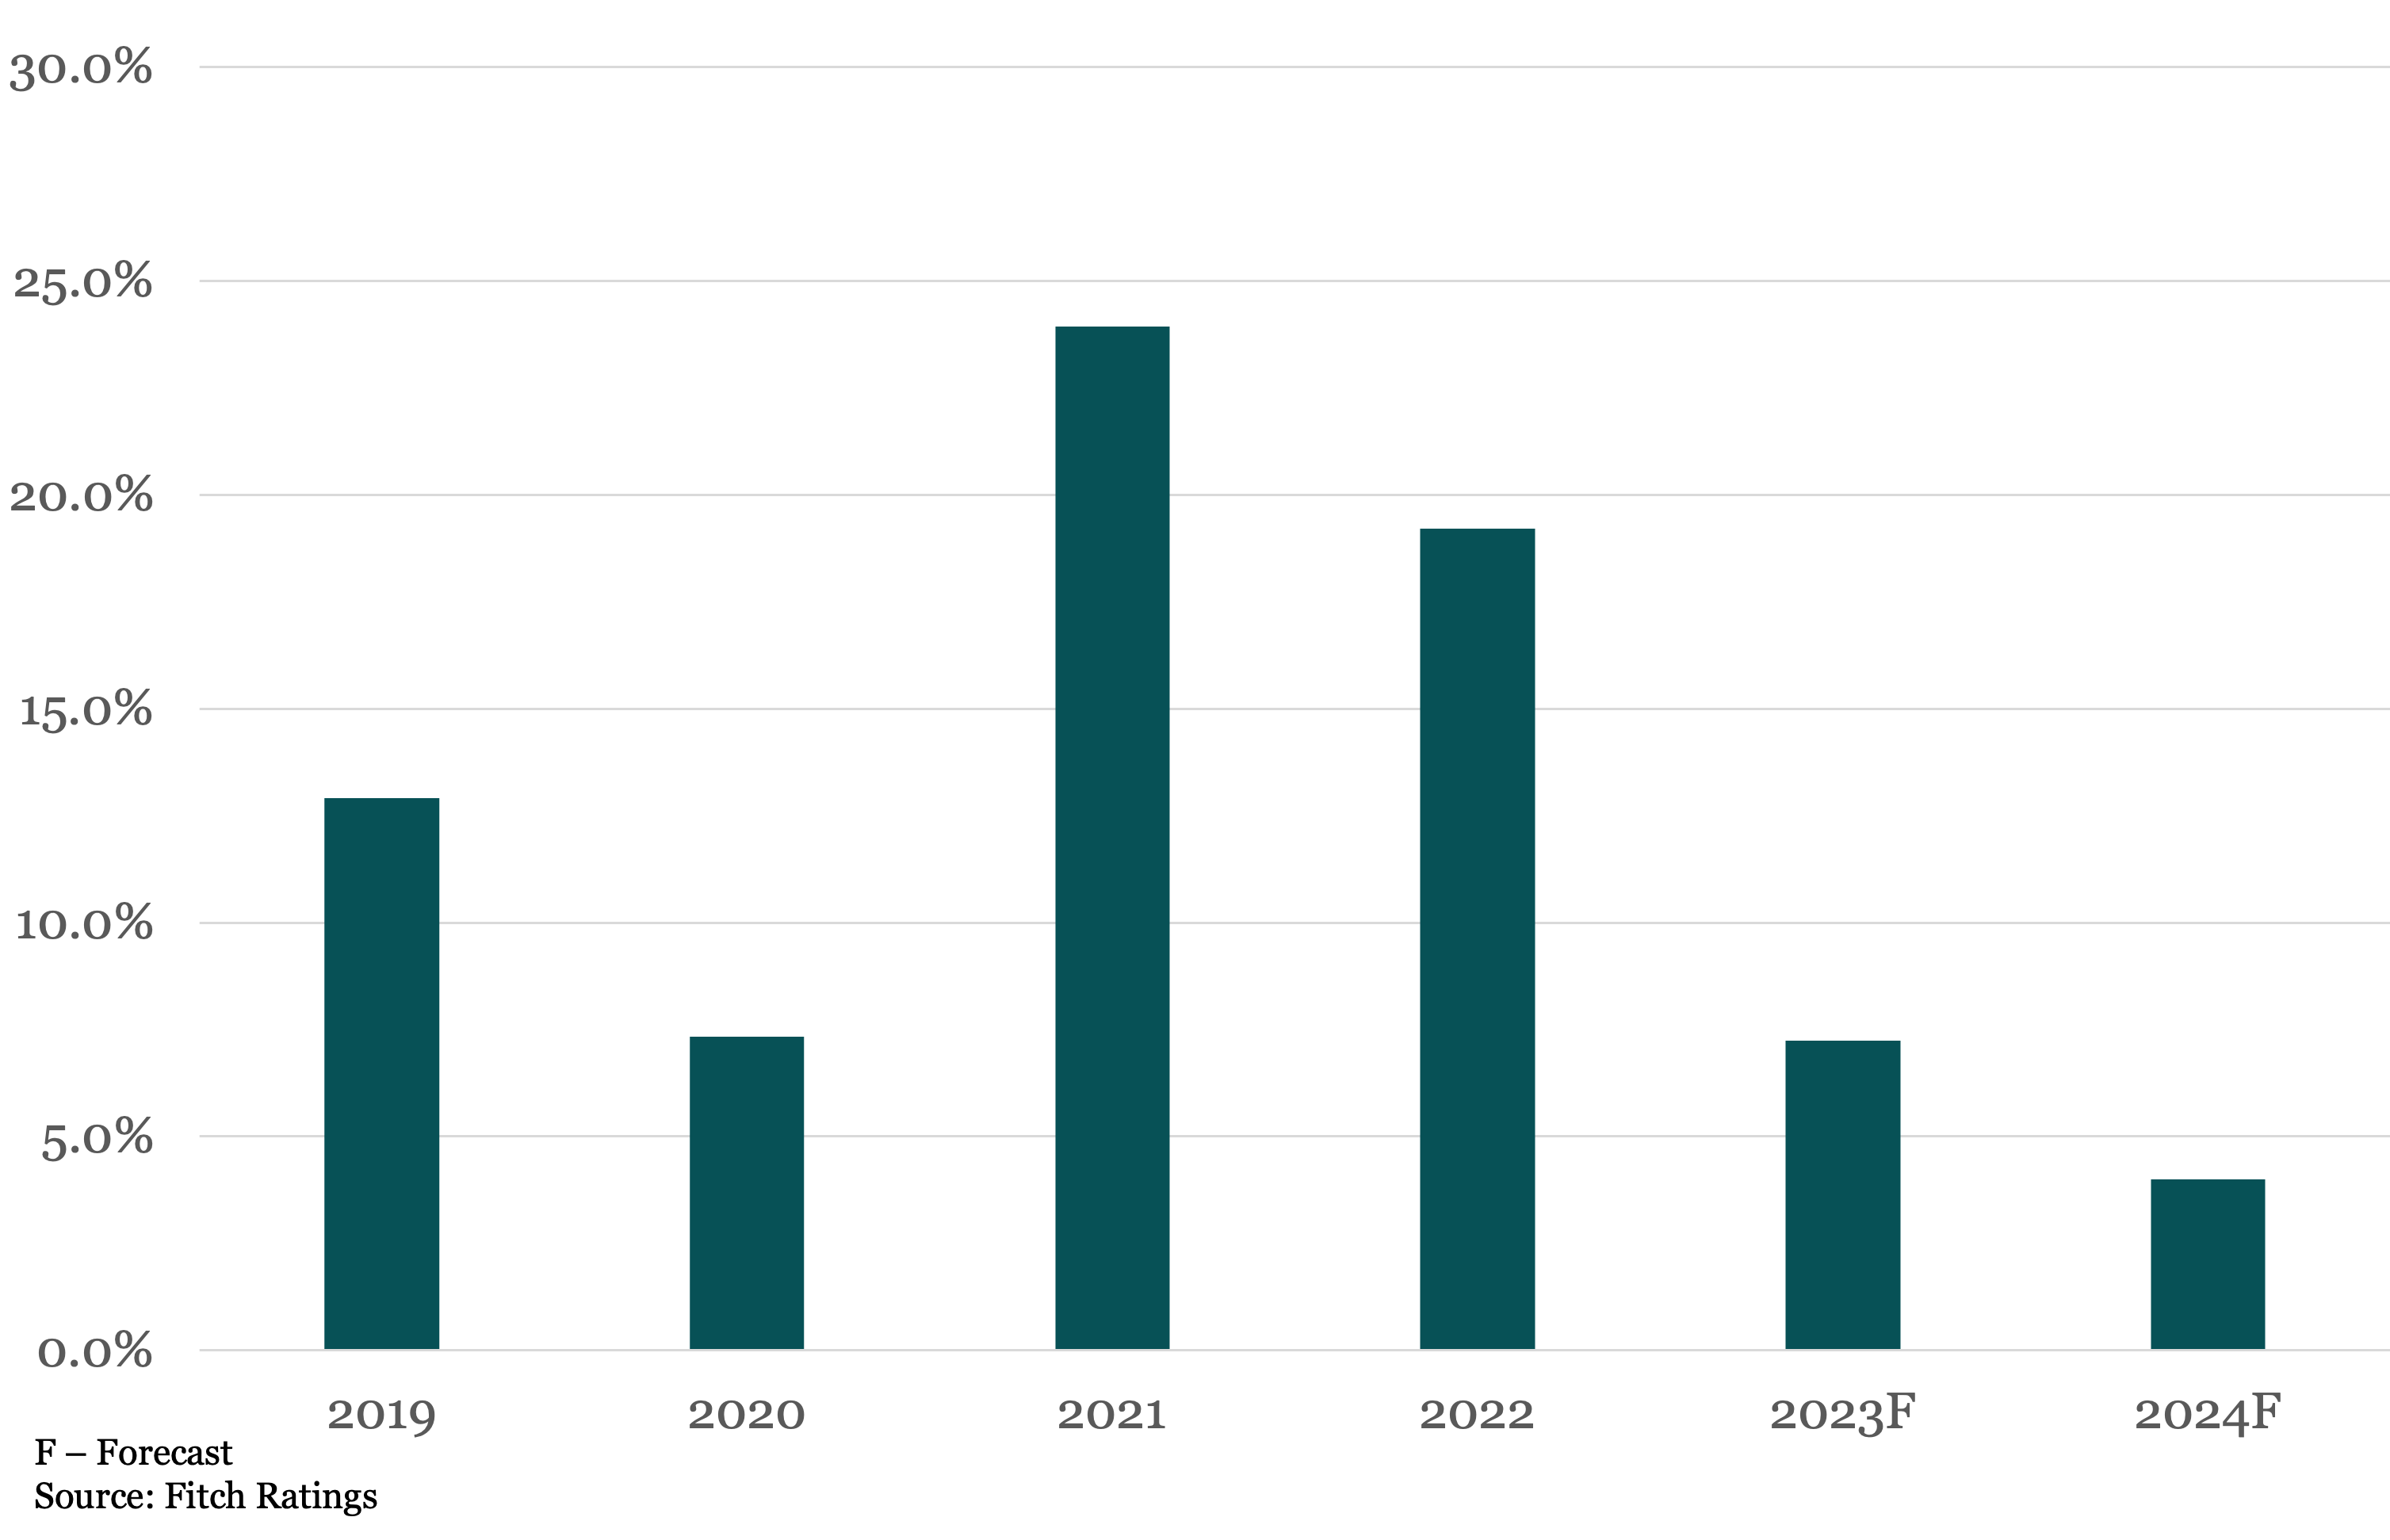
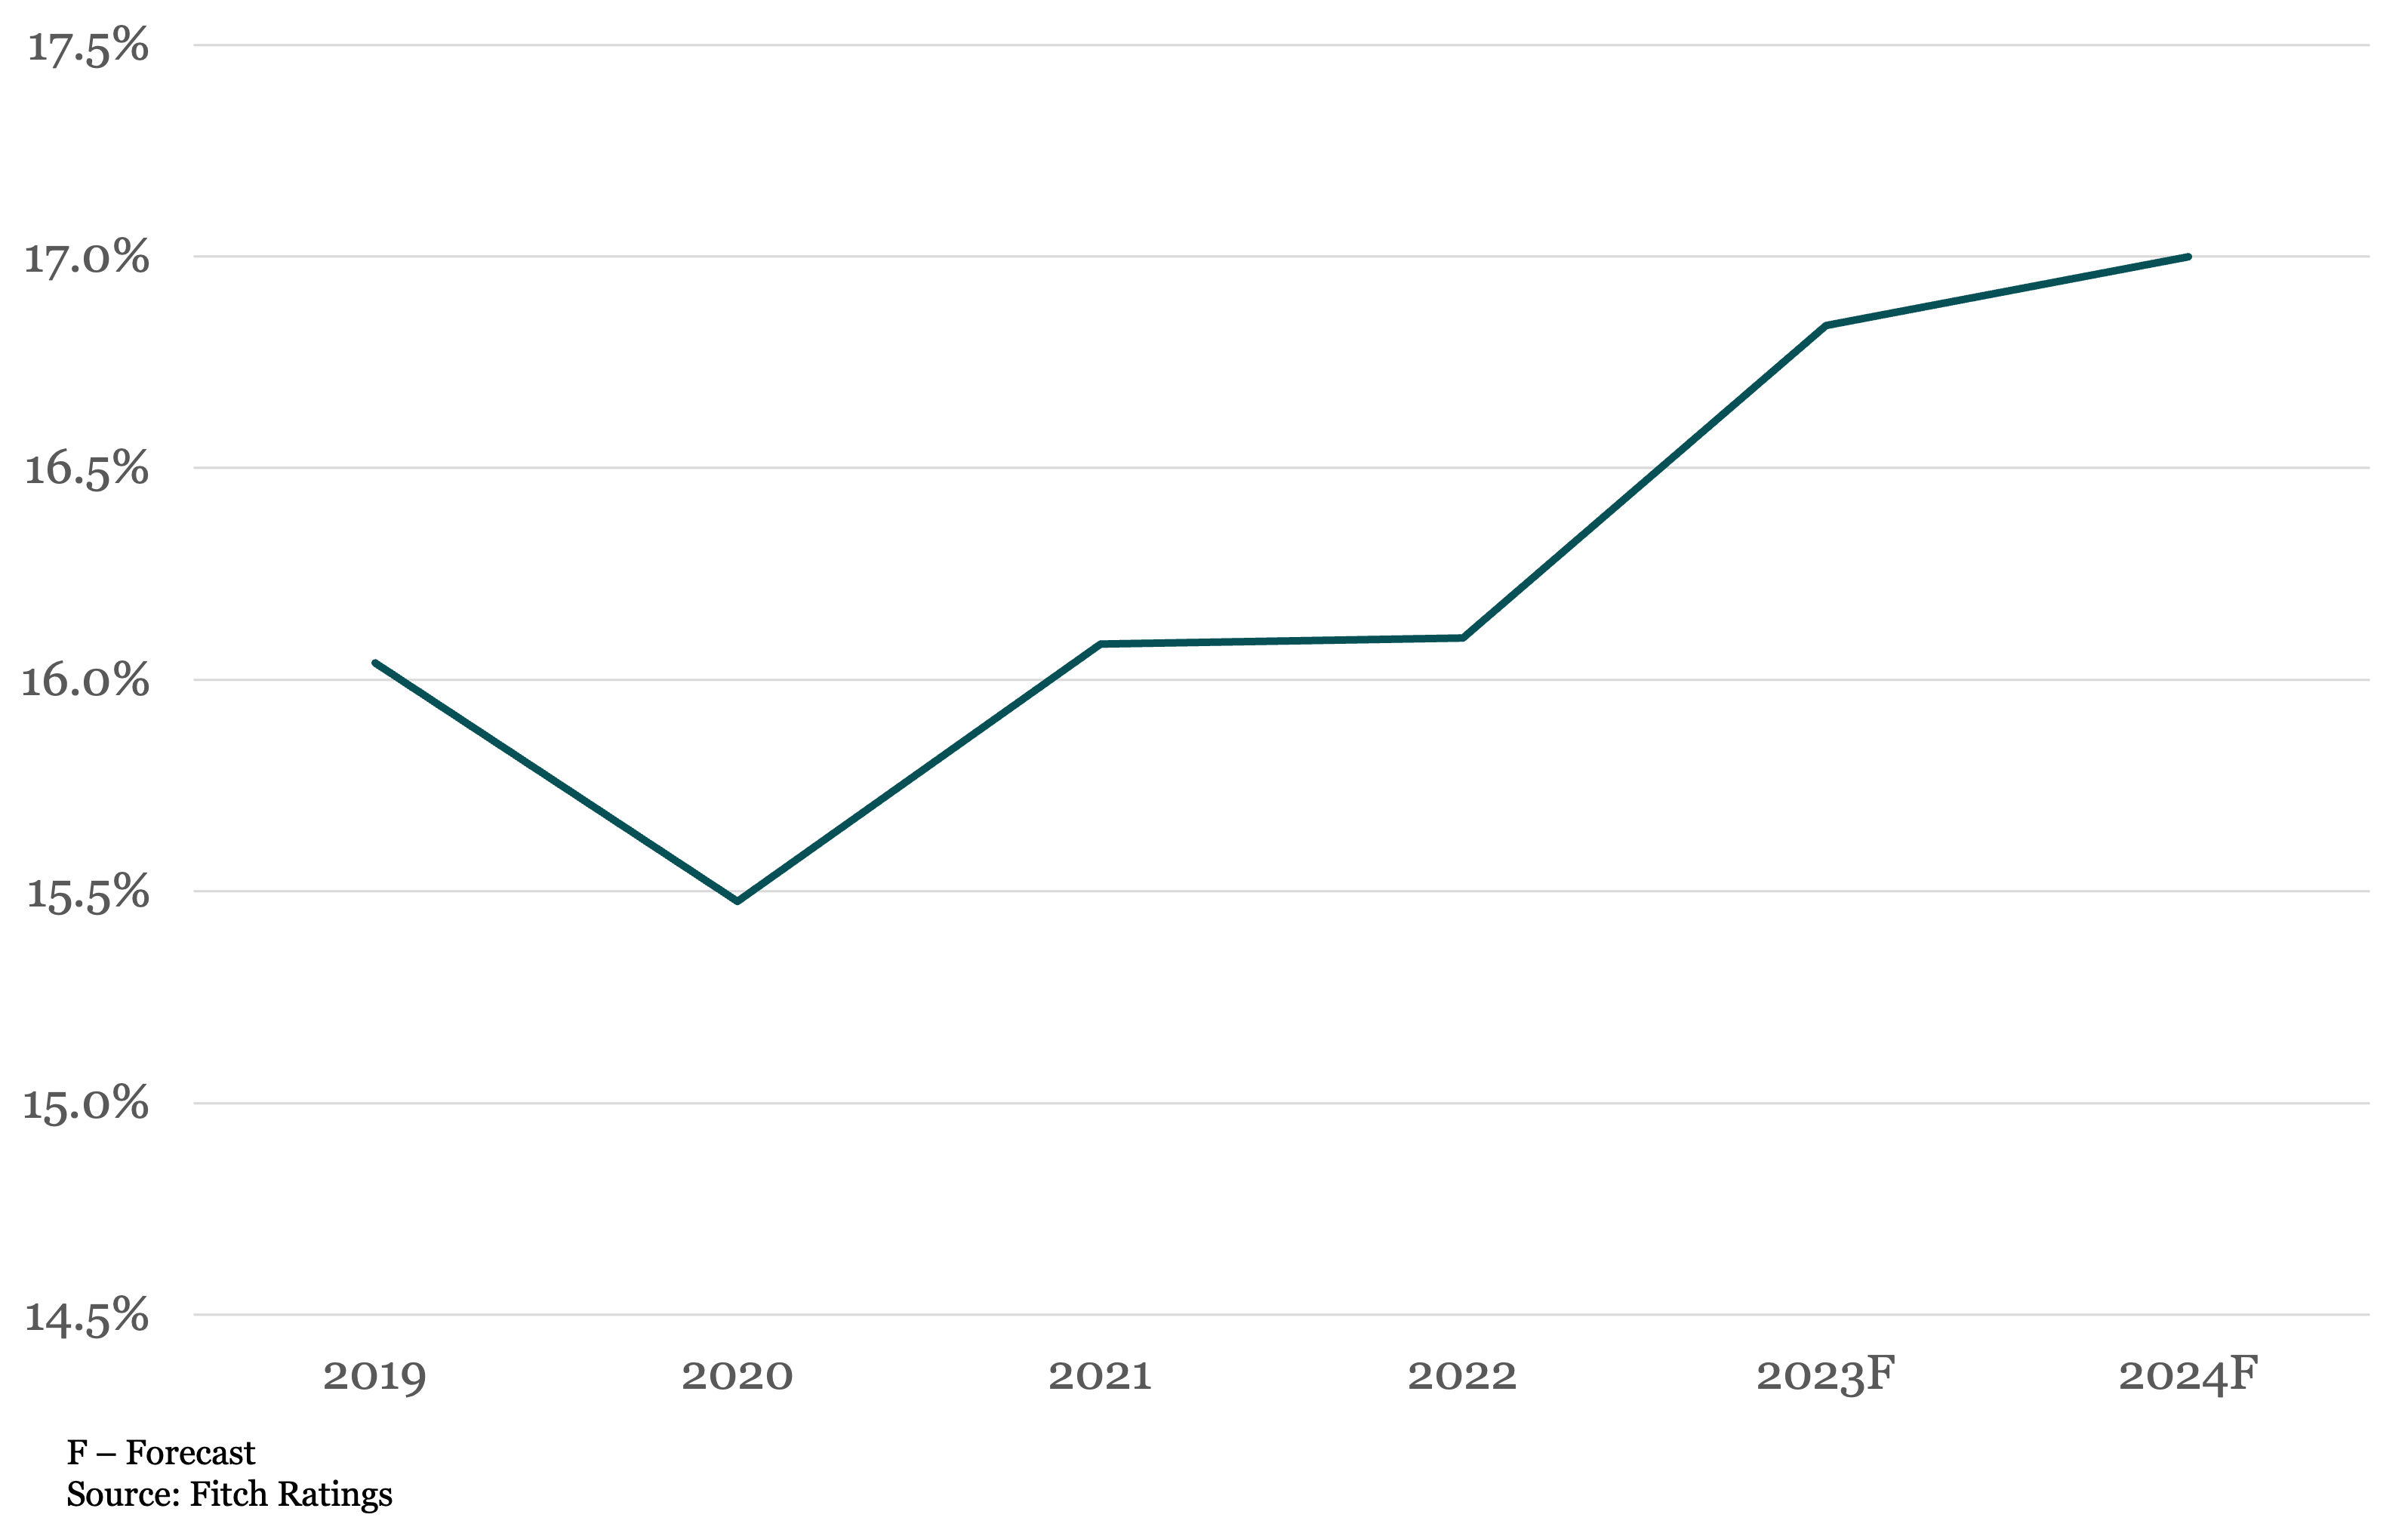
In the charts above, Fitch presents aggregate data for MM companies, defined as in the area of $500 million of debt or $100 million of EBITDA or below, that it privately rates for asset managers.
- Interest coverage (EBITDA/interest) is estimated to have declined to 1.6x in 2023 as a full year of increased rates and refinancings done at higher spreads fully flowed through income statements. In the high interest rate environment, interest coverage takes the spotlight as elevated interest payments can quickly exhaust liquidity for lower rated issuers. However, the utilization of PIK structures has become increasingly common within the private credit market, and has alleviated the cash interest burden for some issuers in Fitch’s portfolio. Historically, coverage had fluctuated in the 2.5x range before the current Fed’s tightening cycle, through which coverage peaked at around 2.7x in 2021 before declining to 2.2x in 2022 and further in 2023.
- Revenue growth is estimated to have moderated to 7.2% in 2023 after two strong years of double-digit growth, albeit on a lackluster 2020 due to the effects of the pandemic. Fitch expects a continued moderation in revenue growth to the midsingle digits for 2024.
- The median EBITDA margin in Fitch’s PMM portfolio shifted upward to 16.8% in 2023 from 16.1% in each of the prior two years as the lagging effects of the pandemic transitioned to the rearview mirror and operating conditions eased over 2023.
(Past performance is no guarantee of future results.)
Contact Brad Hamner




Latest news
Q2'26 BDC analysis shows additional 184 bps of nonaccruals at cost
September 10, 2026
In a universe of 173 business development companies, or BDCs, Octus identified a total of $9.5 billion of debt (at cost) in nonaccrual status reported in the second quarter of 2026, a slight decline of 5% from $10 billion in the first quarter of 2026.

Reading the Board
September 10, 2026
The story changes depending on which numbers you’re counting.
Private Credit Defaults 101: Different Numbers, Different Stories
In Season 2 of Billions, Bobby Axelrod takes his lawyer Orrin Bach to an empty Yonkers racetrack in the dead of night.