



Download FitchRating’s Report here.
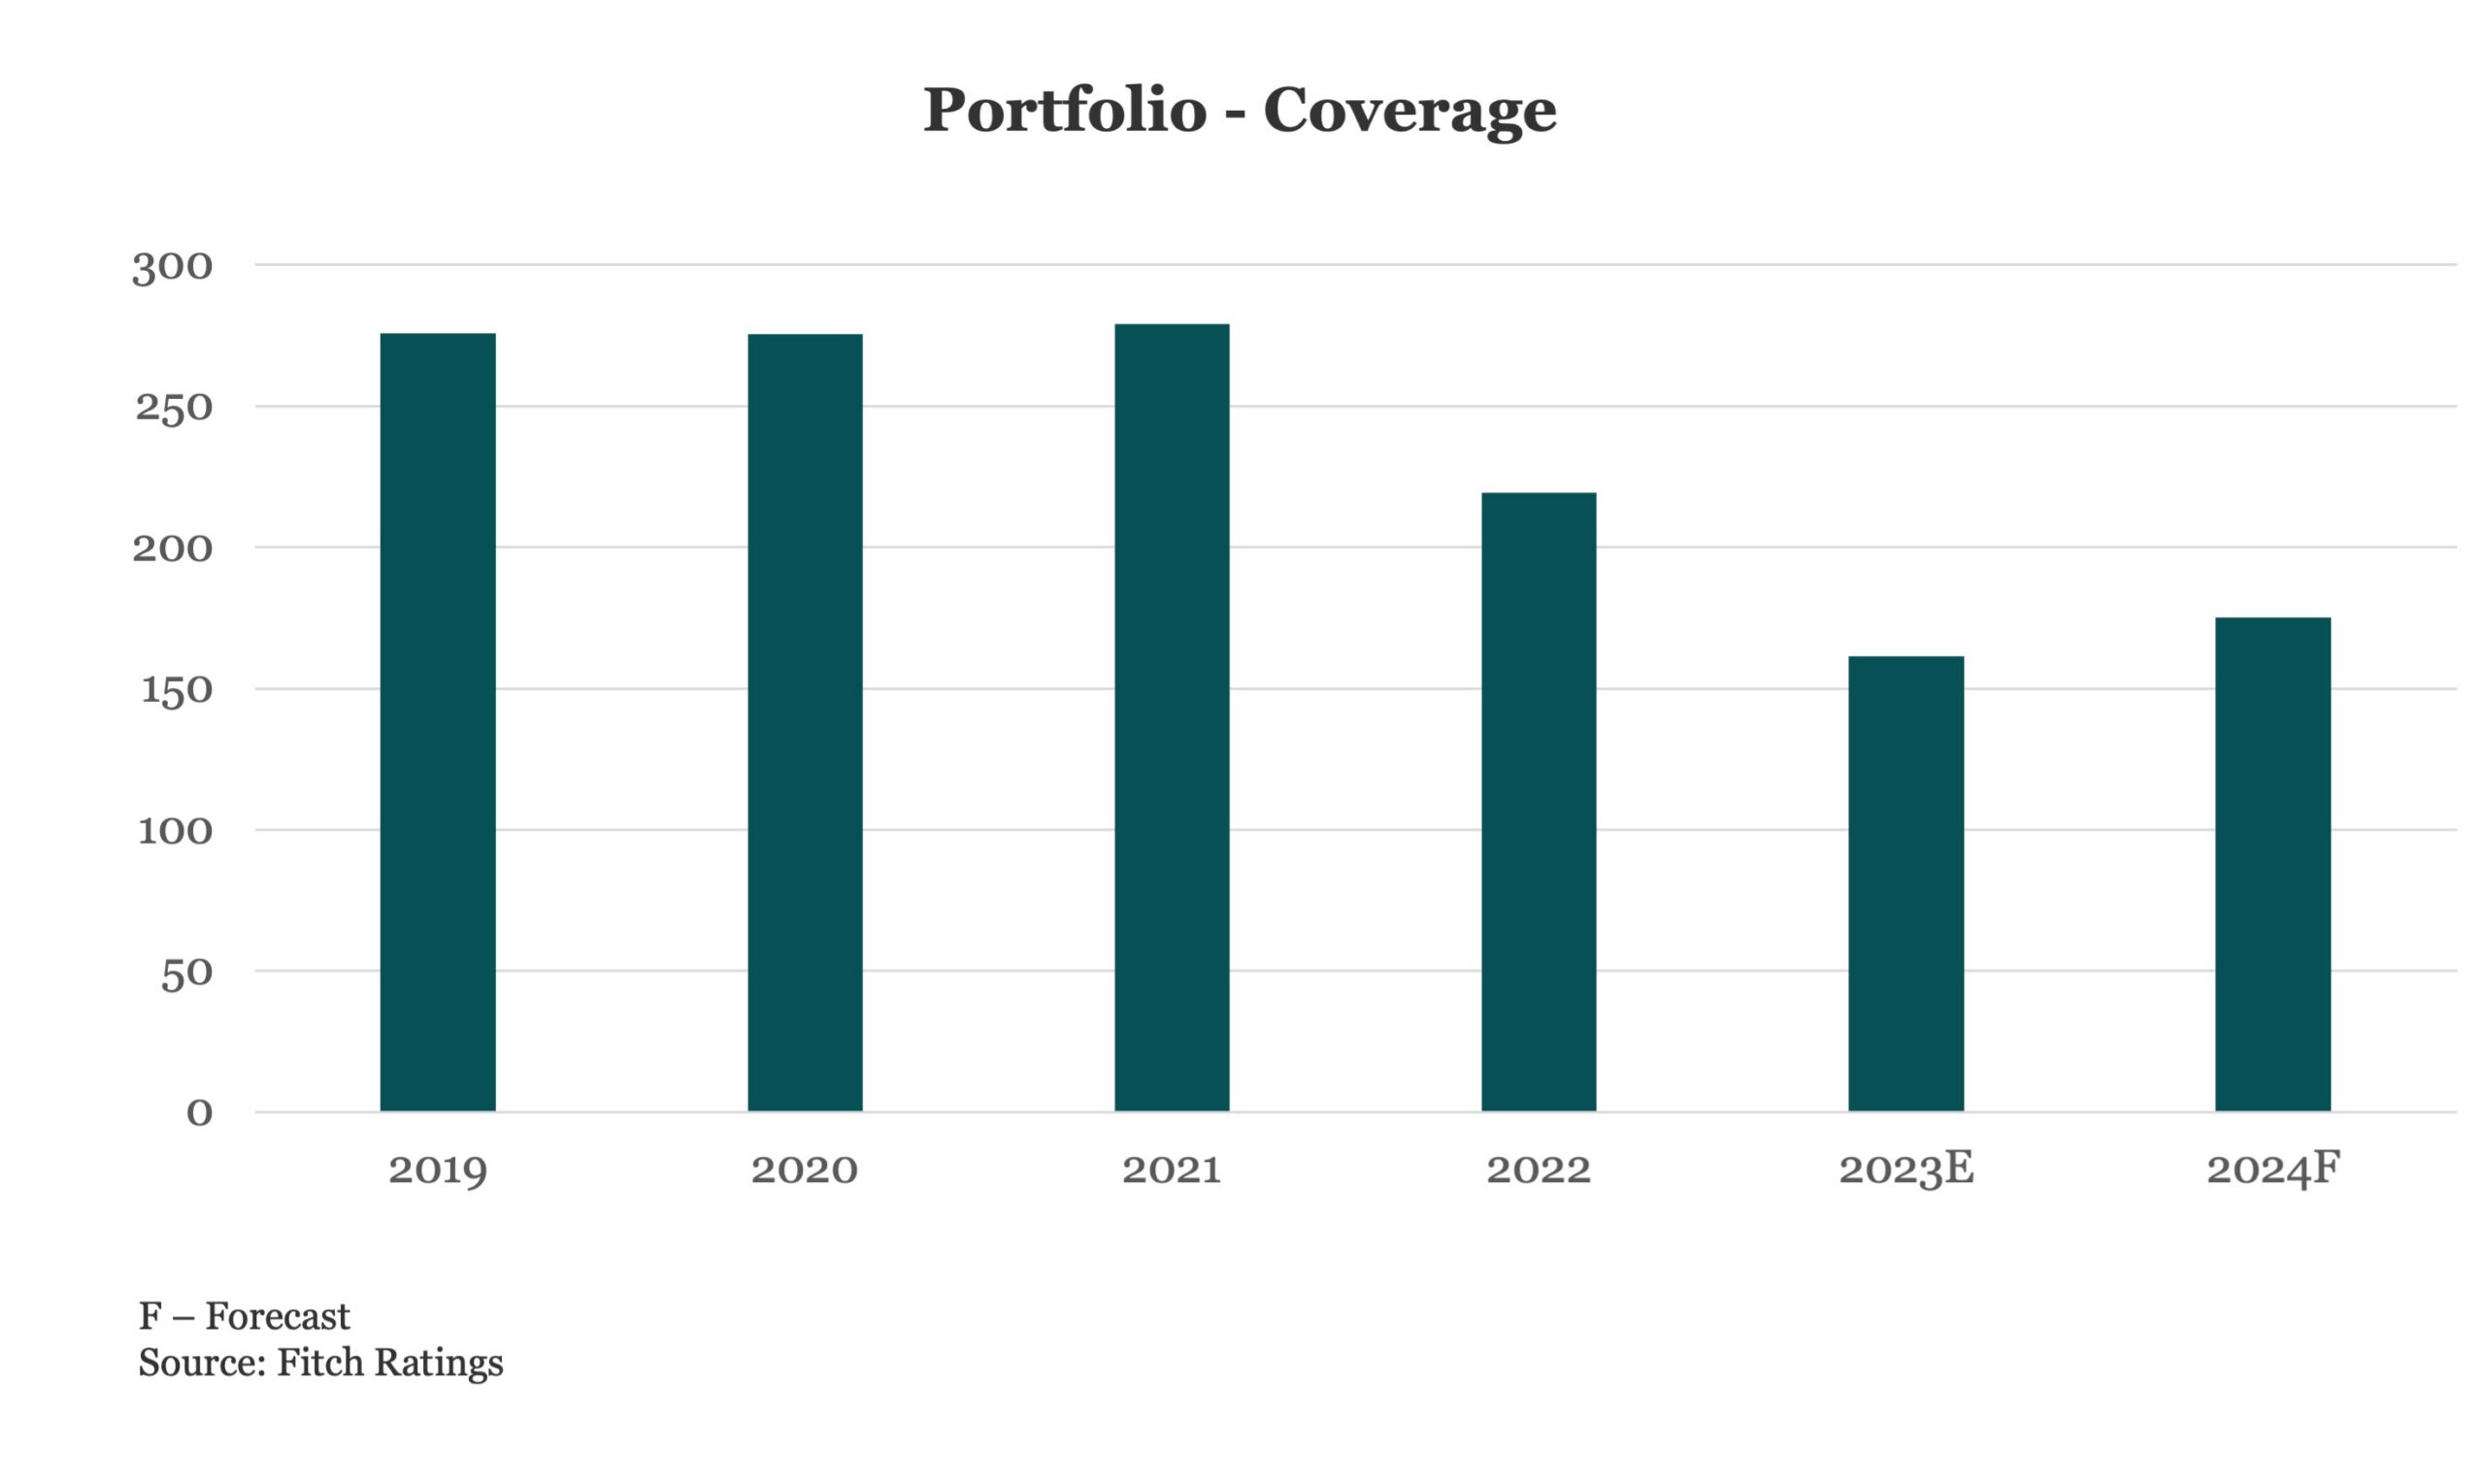
In the charts above, Fitch presents aggregate data for MM companies, defined as in the area of $500 million of debt or $100 million of EBITDA or below, that it privately rates for asset managers.
Increased competition from BSL lenders pressured new-issue spreads for MM loans executed in 1Q24. Fitch currently forecasts Interest coverage (EBITDA/Interest) to increase marginally in 2024 to 1.8x from 1.6x in 2023, driven both by higher EBITDA and a declining base rate, though interest rate forecasts remain volatile. Although the market has seen some relief this quarter, high interest rates persist, and the focus remains on Interest Coverage and FCF as elevated interest payments may rapidly deplete liquidity at lower-rated issuers. Historically, coverage had fluctuated in the 2.5x range before the current Federal Reserve tightening cycle, through which coverage peaked at around 2.7x in 2021 before declining to 2.2x in 2022 and further in 2023.
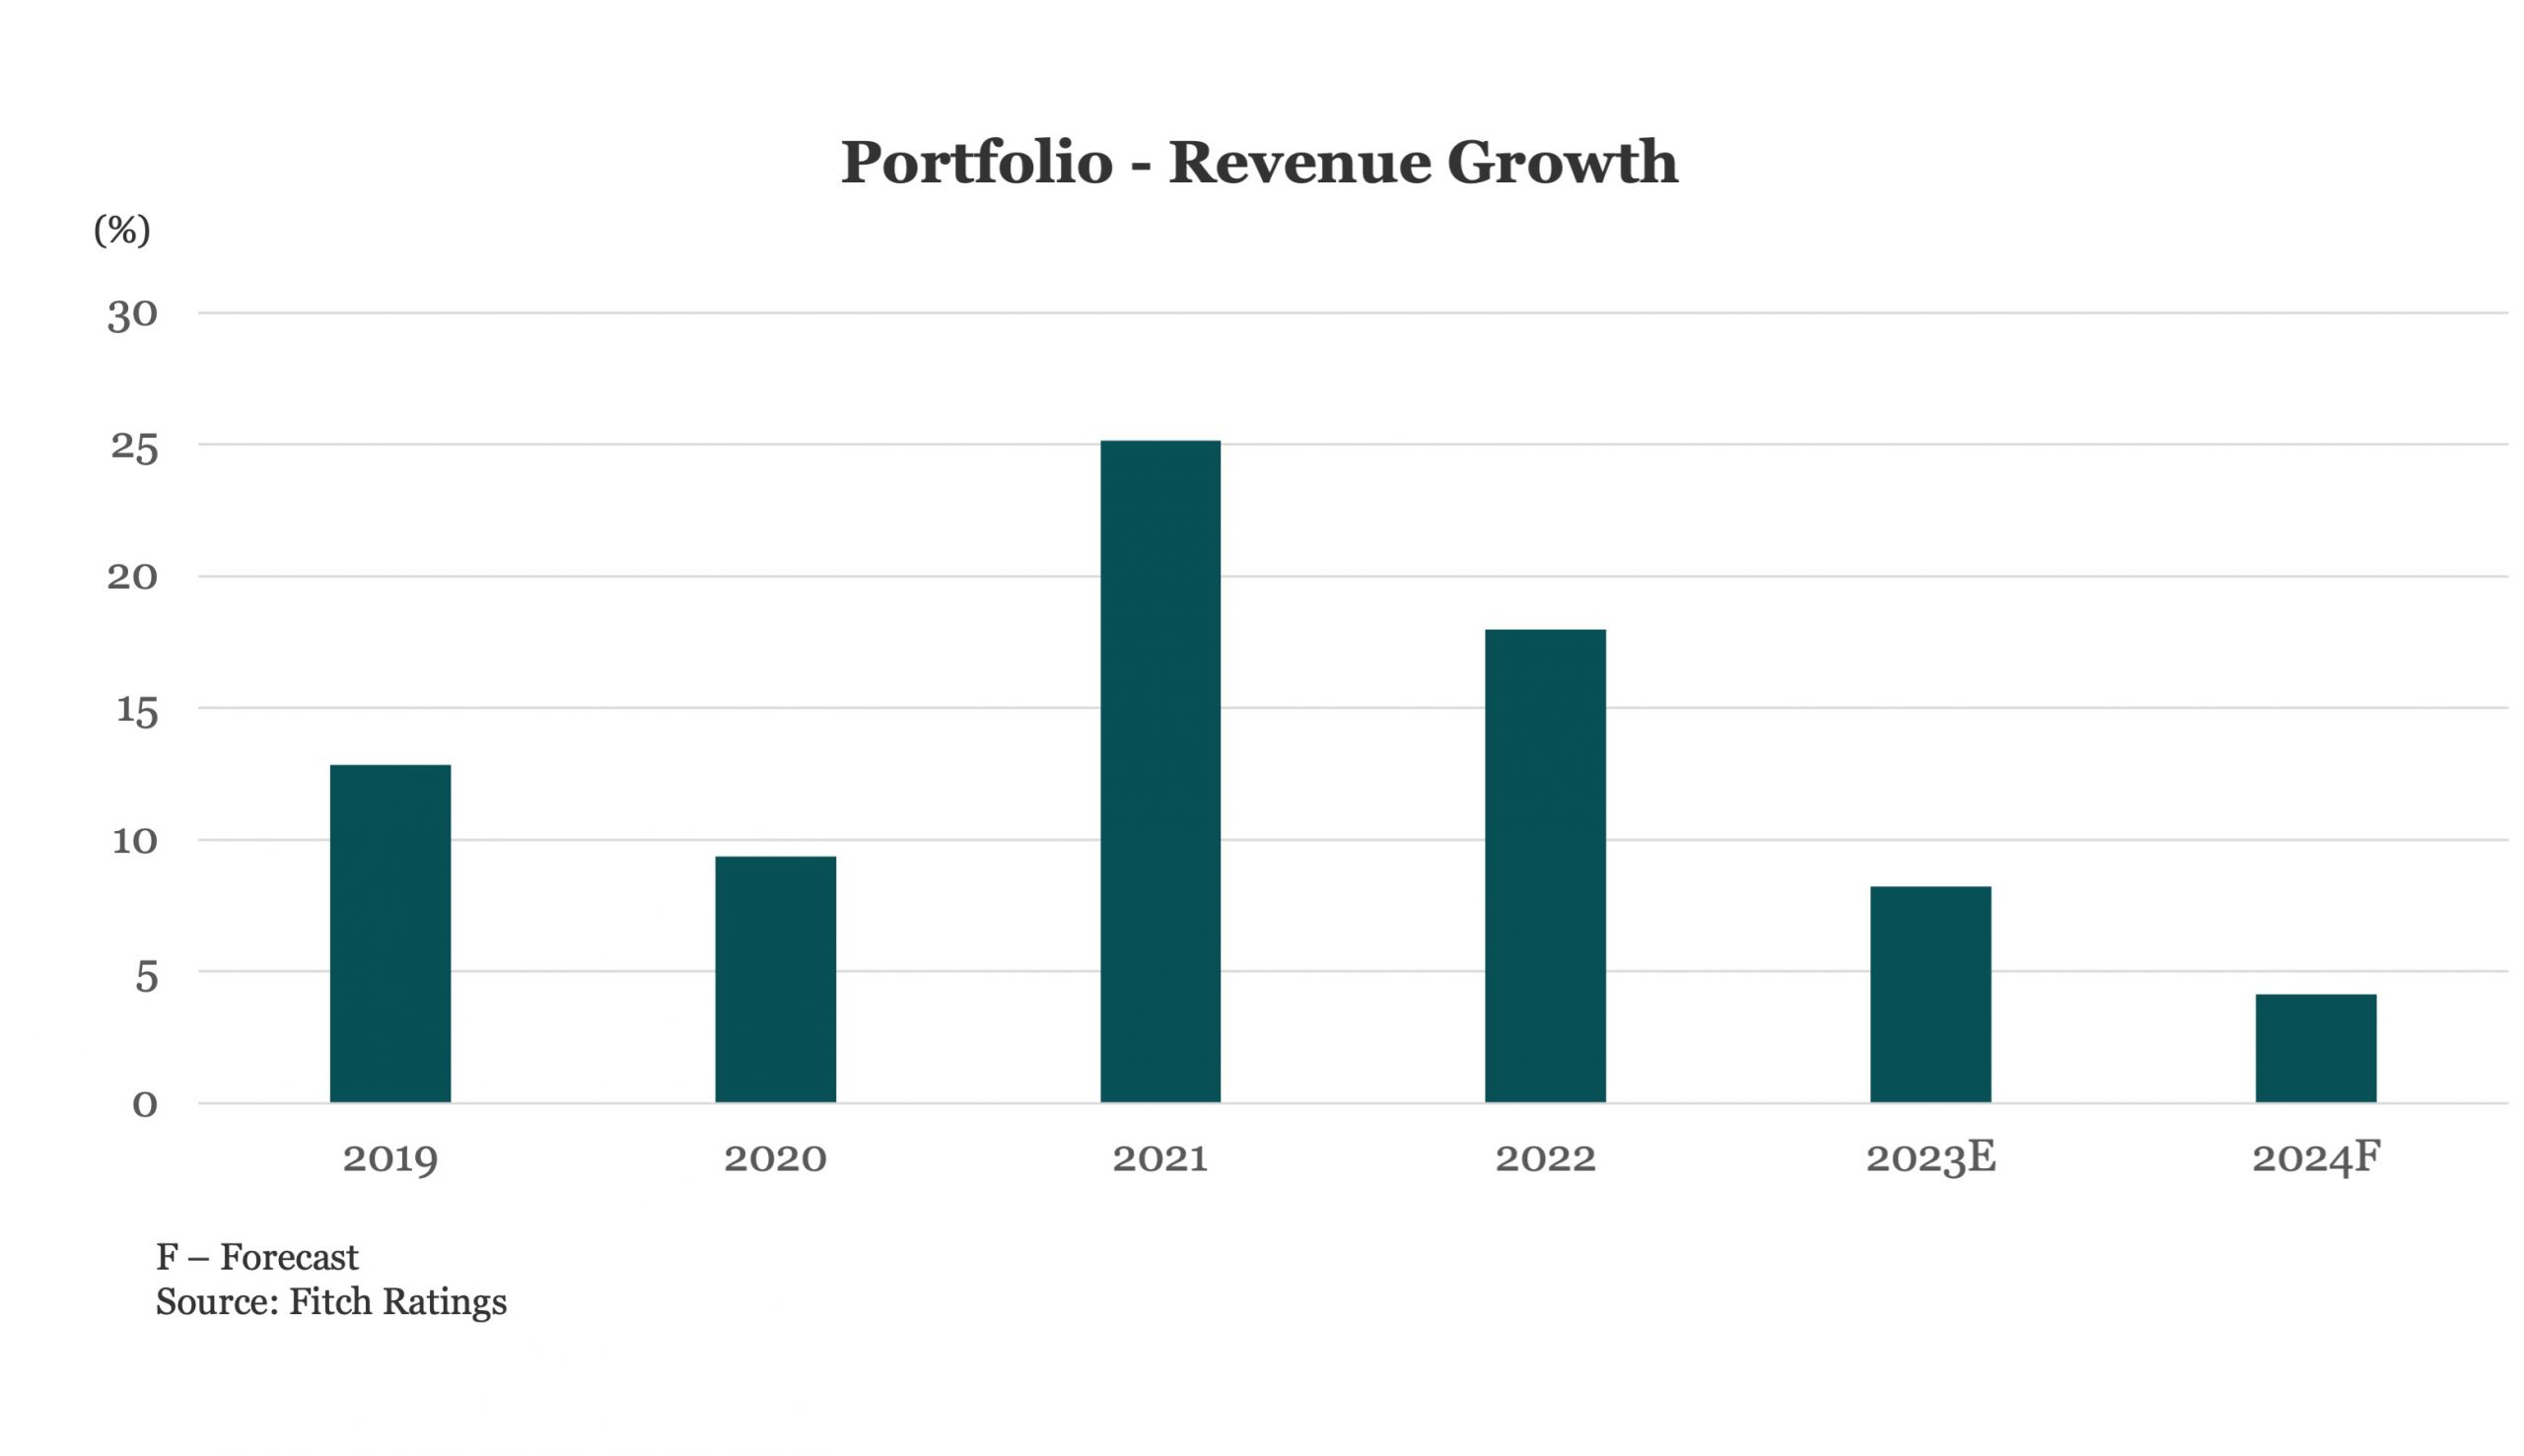
Fitch estimates revenue growth moderated to 8.2% in 2023 after two strong years of double-digit growth, albeit on a lackluster 2020 due to the impacts of the pandemic. Fitch expects a continued moderation in revenue growth to the mid-single digits for 2024.
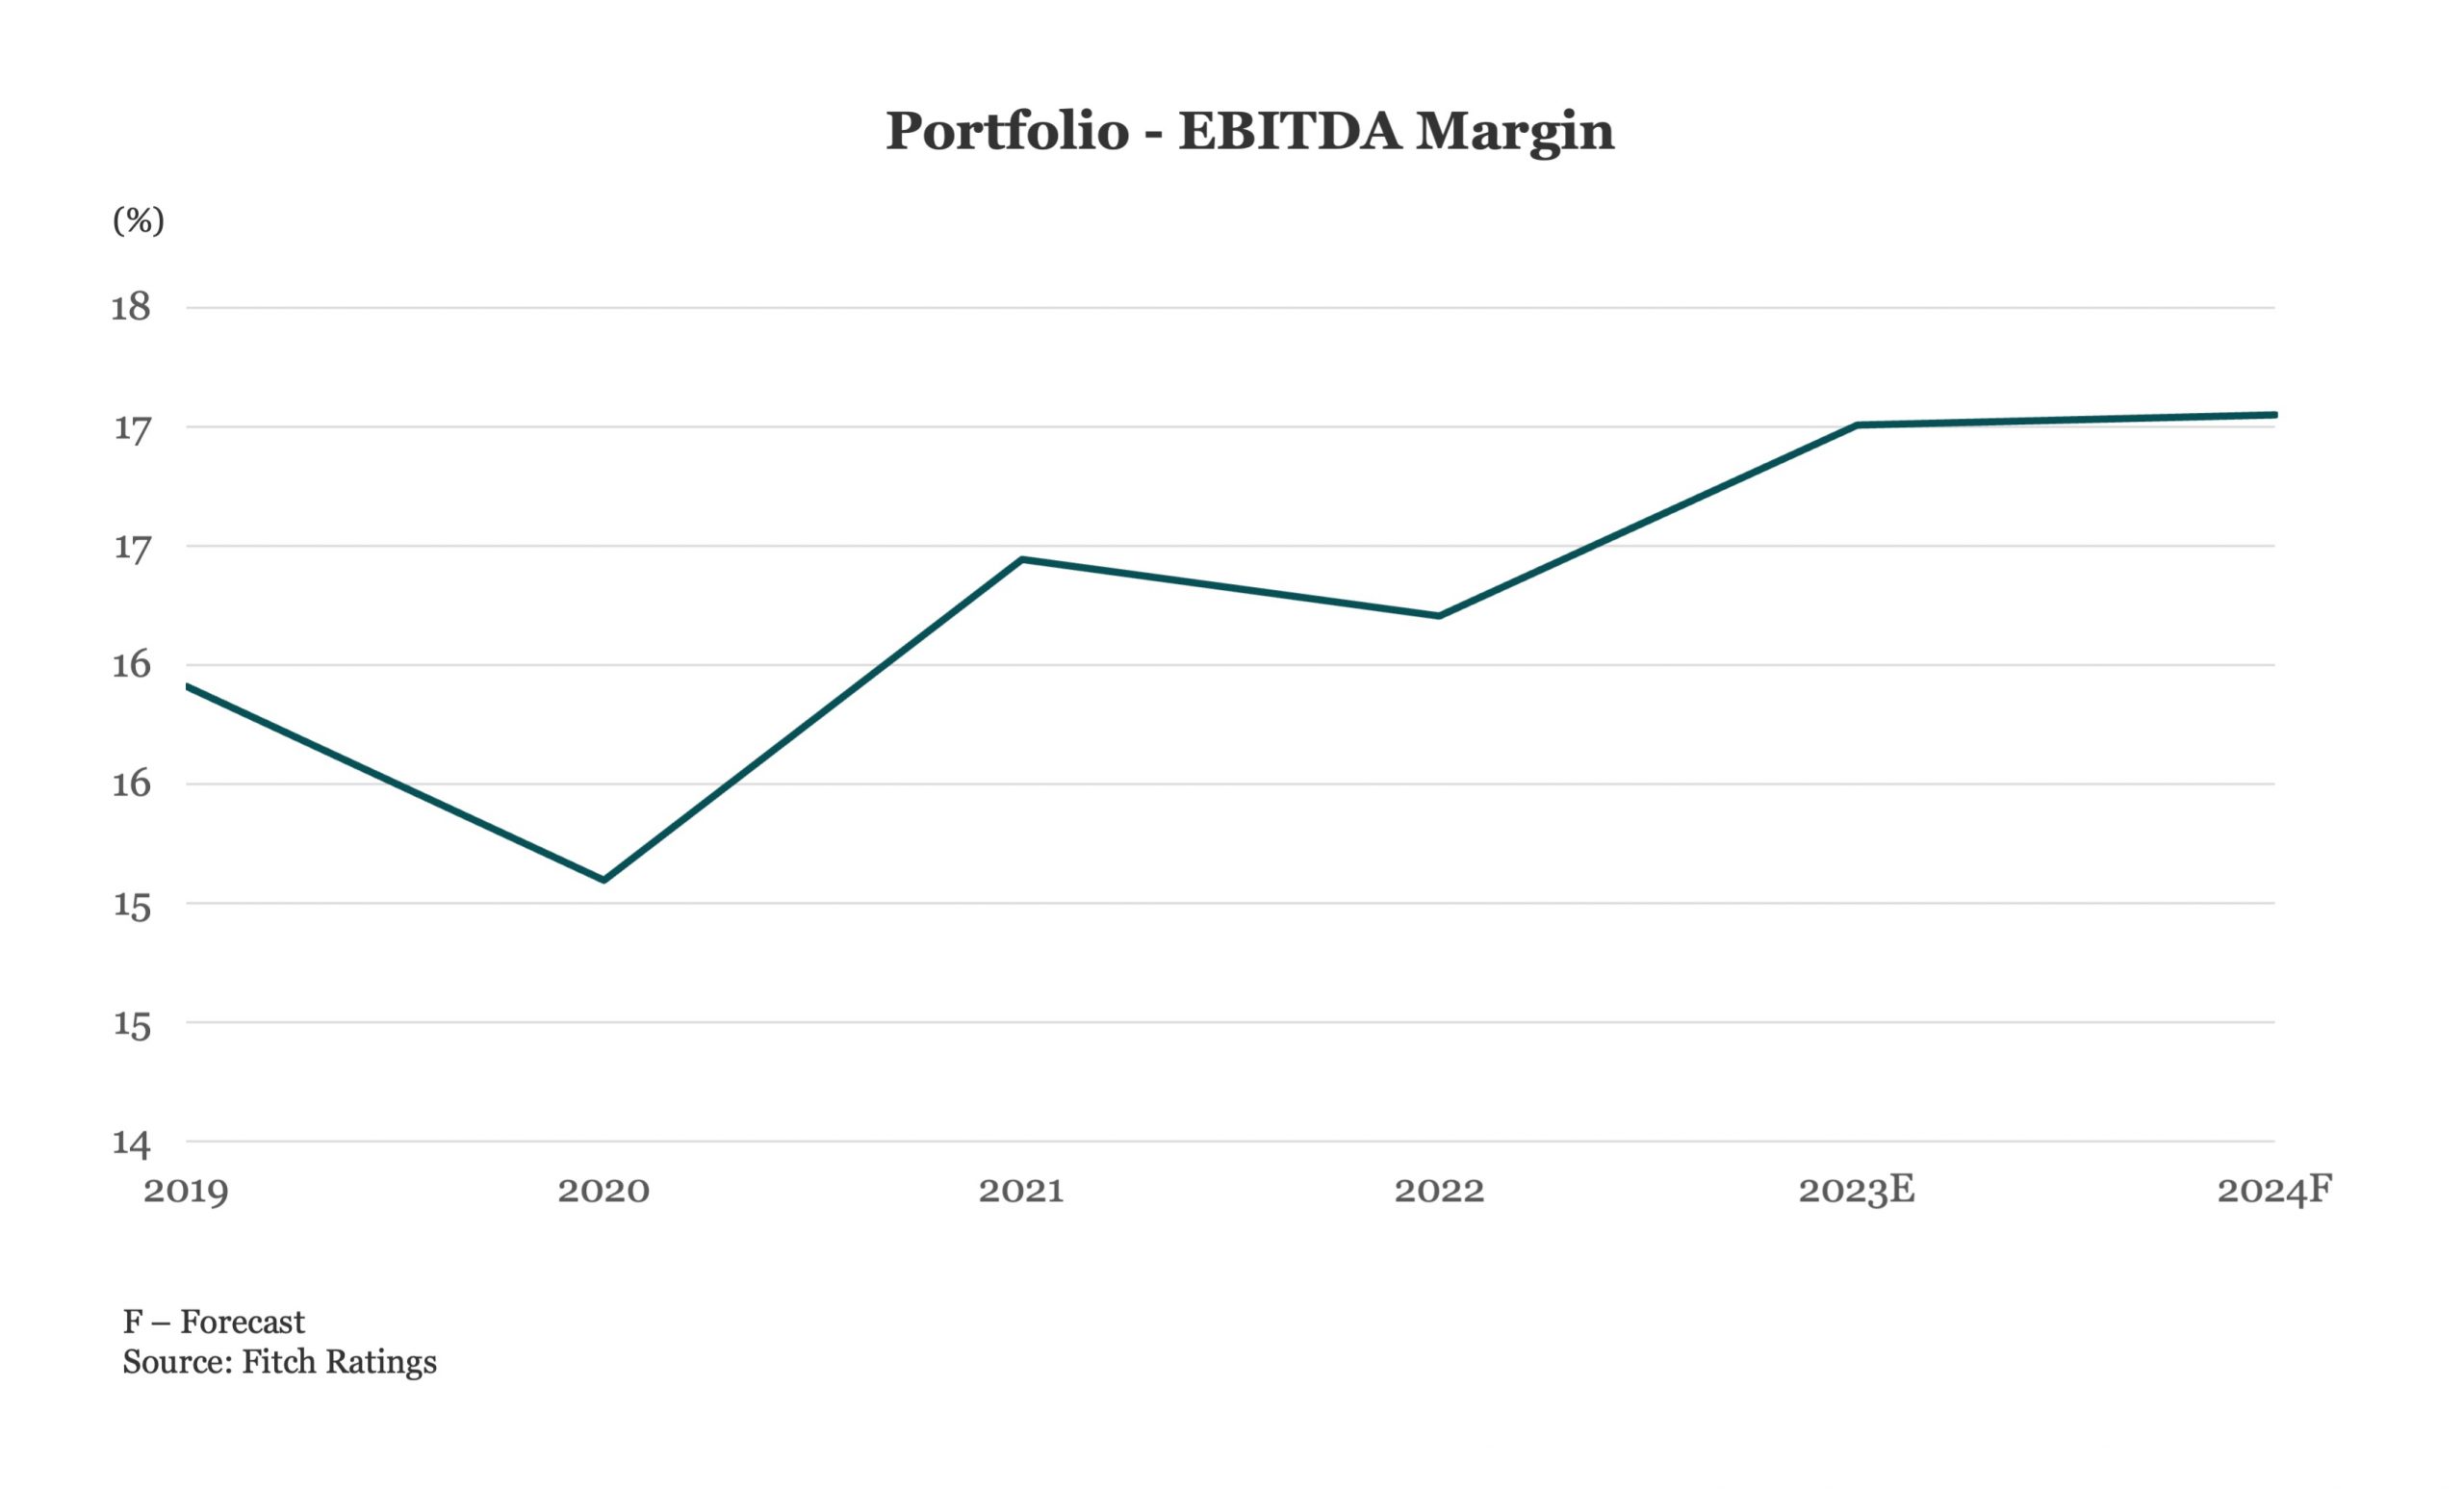
The median EBITDA margin in Fitch’s PMR portfolio shifted upward to 17% in 2023 from 16.2% in the prior year as the lagging impacts of the pandemic transitioned to the rearview mirror and operating conditions eased over 2023.



Latest news

US Leveraged Loans Return 3.36% to Investors YTD
The Bloomberg US Leveraged Loan Index (Ticker: LOAN) returned 0.96% in August and has gained an additional 0.28% through September…

PE dry powder
The capital that is being raised is flowing overwhelmingly to the largest, most established managers.

Middle market debt held by BDCs vs High yield vs Treasury yields
The blue line represents the current dividend yield of the VanEck BDC Income ETF (BIZD), which stood at 11.7% as…