



Download FitchRating’s Report here.
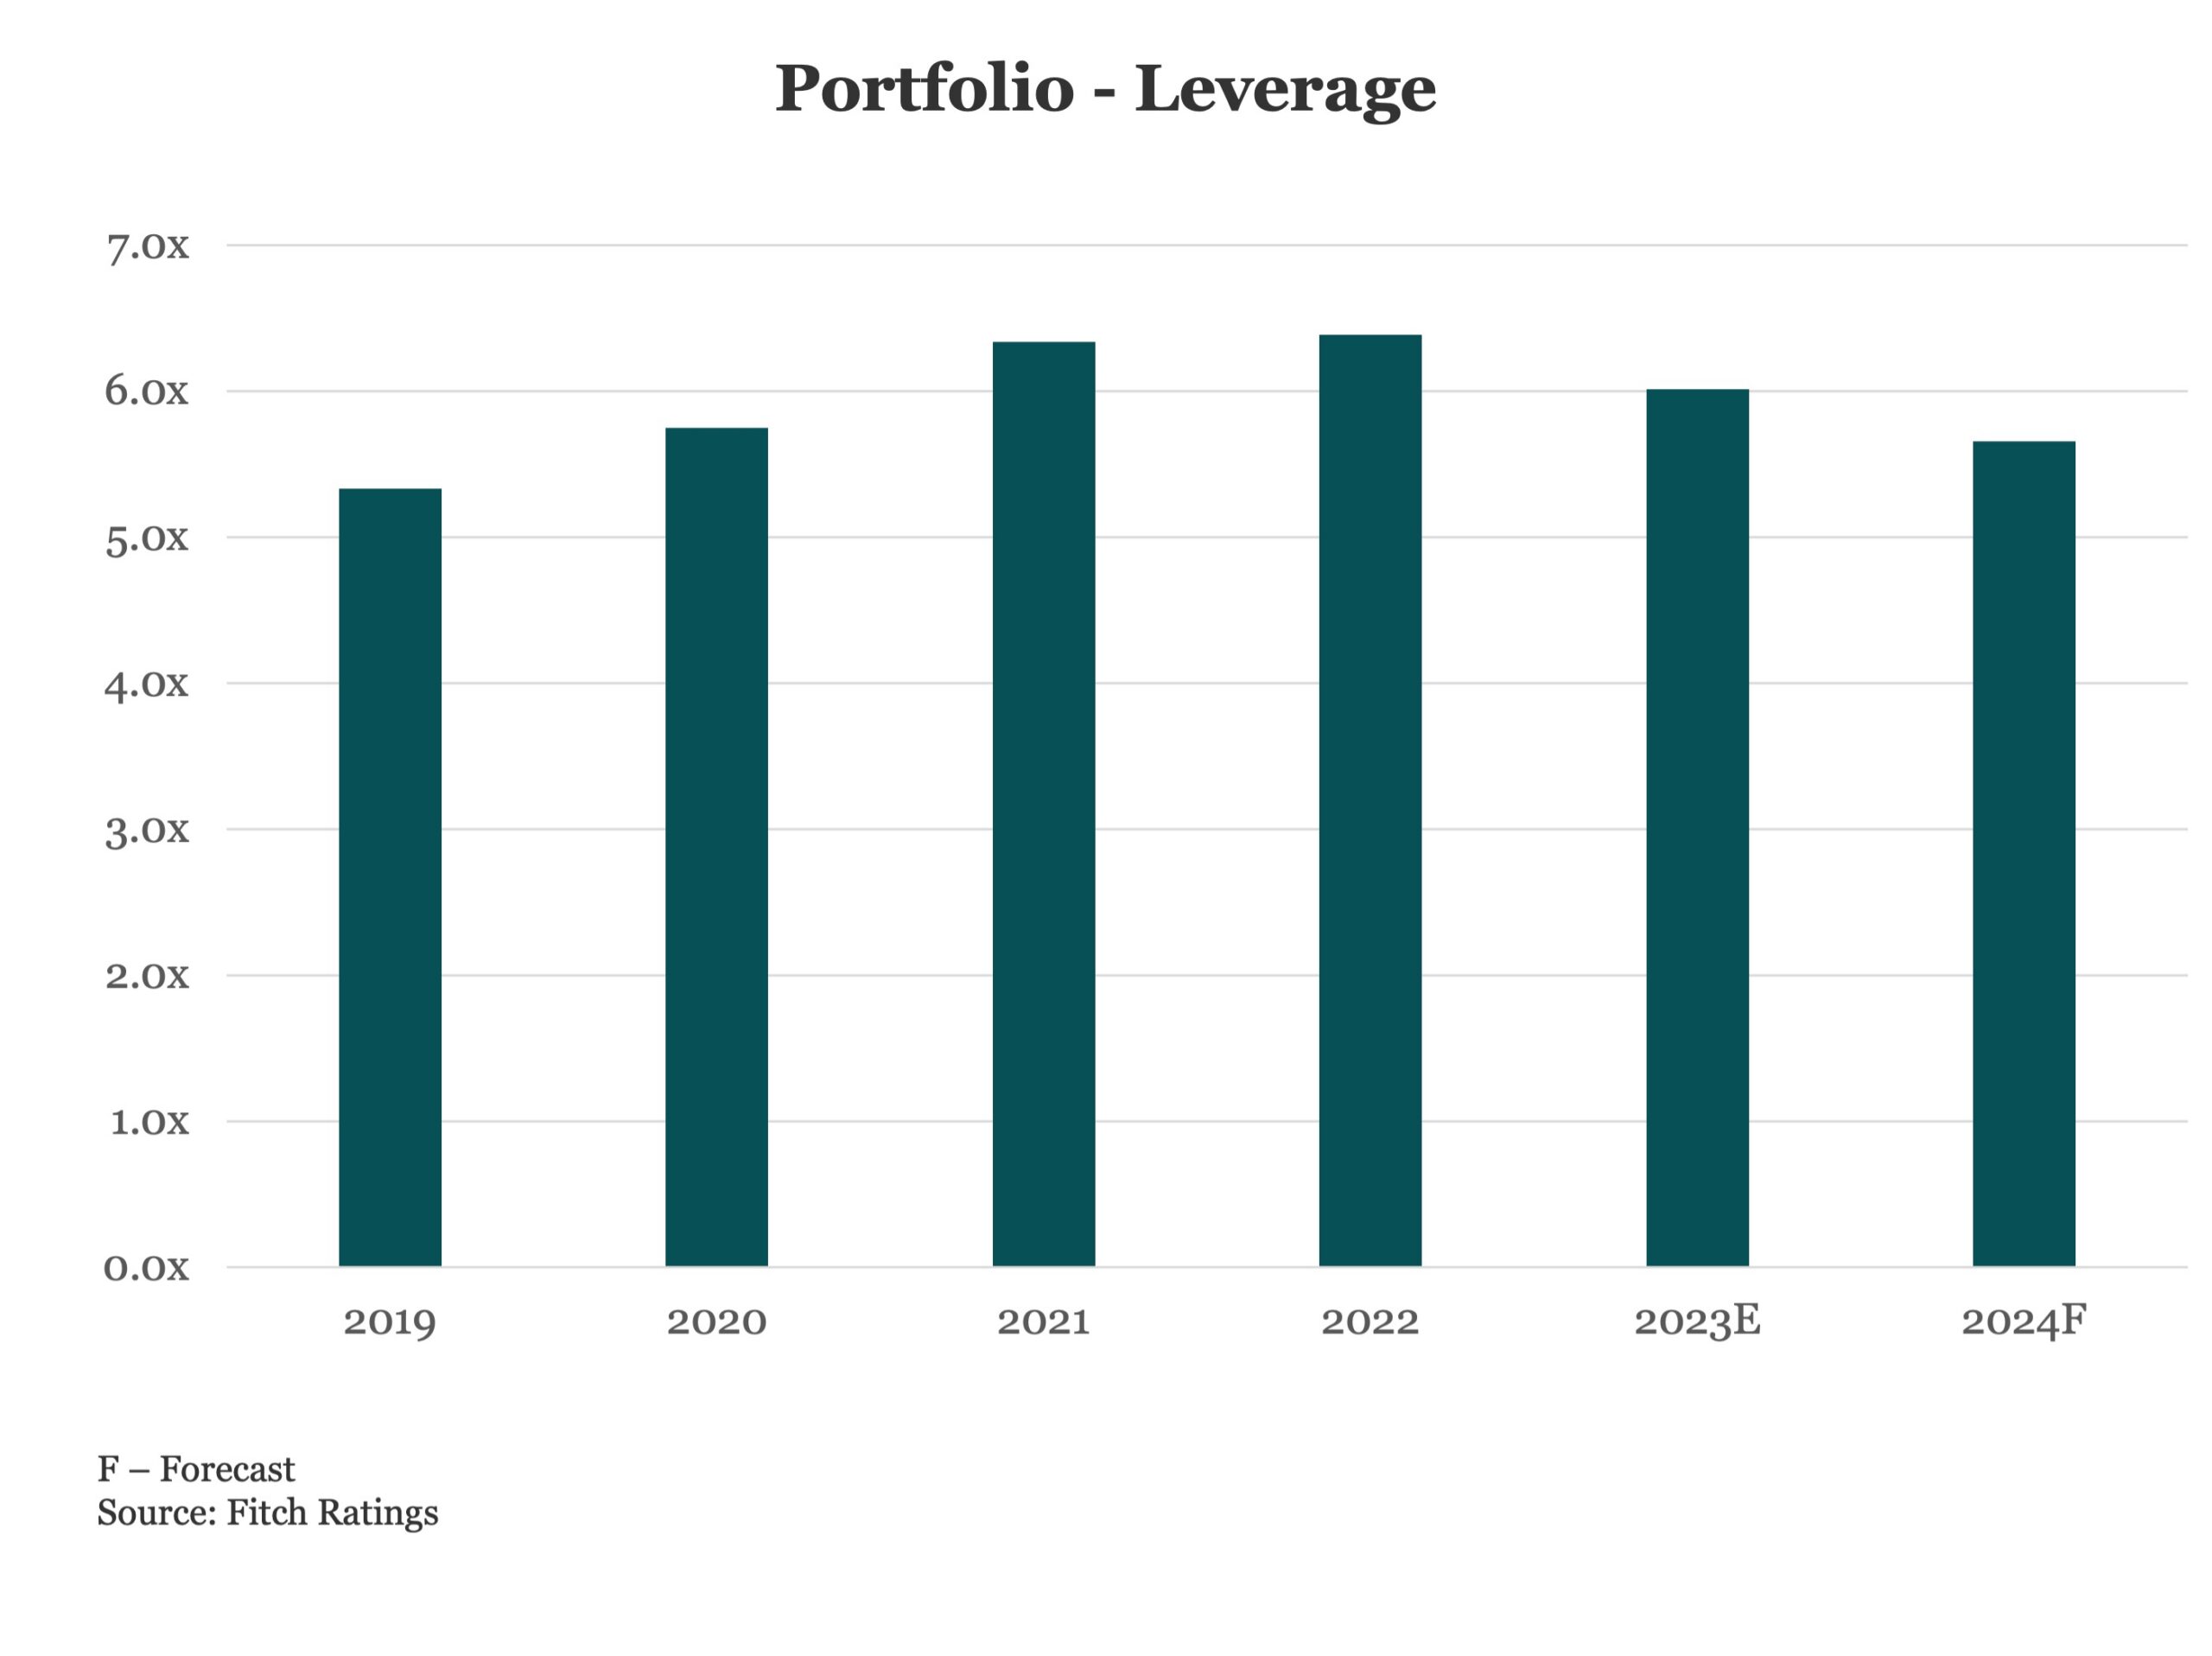
In the chart above, Fitch presents aggregate data for MM companies, defined as in the area of $500 million of debt or $100 million of EBITDA or below, that it privately rates for asset managers. Fitch estimates median EBITDA leverage of 6.0x for 2023 and forecasts the deleveraging trend to continue in 2024 to 5.7x. EBITDA leverage rose to 6.3x in 2021 from 5.3x in 2019 as issuers grappled with stresses from the pandemic and the aftermath effects including inflationary input costs, supply chain and labor issuers, as well as higher-for-longer interest rates. A 1.5x decline in the Diversified Services sector to 4.9x from 6.3x in 2022 led the decrease in 2023 portfolio leverage. After a challenging year in 2022, the sector rebounded notably, with its margin rising to 18.4% from 15.9%. The Health Care sector also contributed to the overall portfolio’s EBITDA leverage decline in 2023, declining 1.3x Yoy to 6.5x. Volume normalizations and durable long-term demand in this sector are offset by higher labor costs, albeit easing, and continuing high interest rate pressure on FCF.



Latest news

US Leveraged Loans Return 3.36% to Investors YTD
The Bloomberg US Leveraged Loan Index (Ticker: LOAN) returned 0.96% in August and has gained an additional 0.28% through September…

PE dry powder
The capital that is being raised is flowing overwhelmingly to the largest, most established managers.

Middle market debt held by BDCs vs High yield vs Treasury yields
The blue line represents the current dividend yield of the VanEck BDC Income ETF (BIZD), which stood at 11.7% as…