



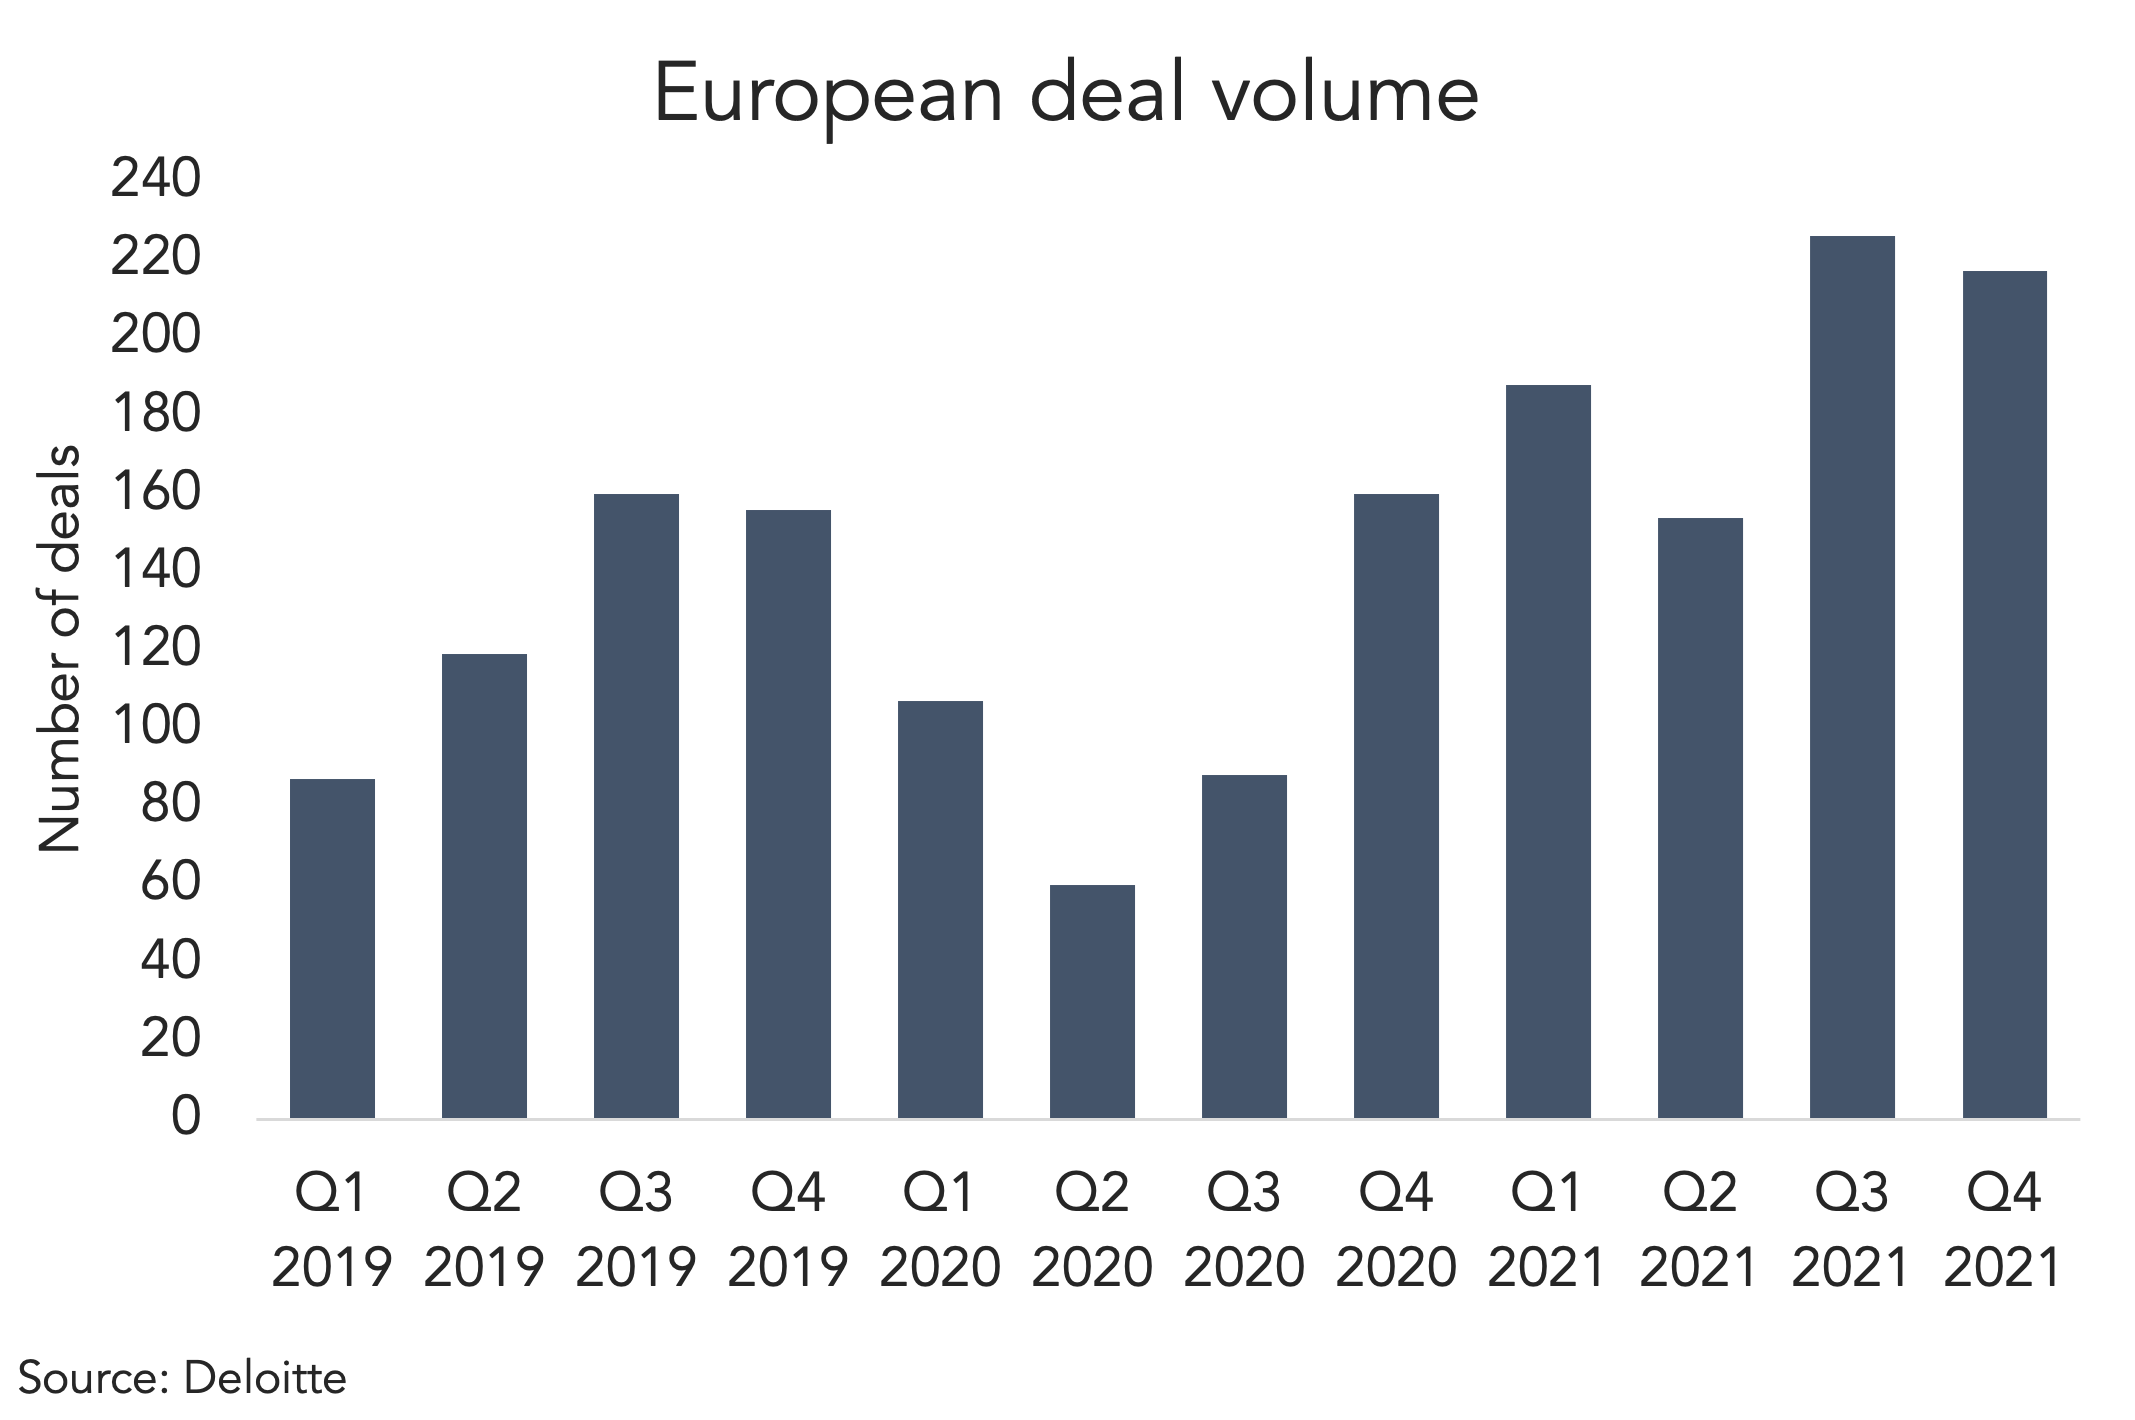
Private debt deals may take a temporary pause when confronted with volatility, but they soon bounce back.
Private debt dealflow typically picks up strongly following market shocks. This was one of the key findings as Deloitte took a look back over ten years of its Alternative Lender Deal Tracker, a database of private debt transactions in Europe.
The most recent example was last year when, following the worst of the covid pandemic, deals increased by 89 percent year over year (see chart above). It was not, however, the only example. The year following the Brexit referendum in 2016, deals increased by 37.5 percent. Indeed, Deloitte also points out that the asset class’s most significant growth occurred after the global financial crisis in 2008-09.
The question now is whether current challenges relating to inflation and the war in Ukraine will precede a similar trend. “With geopolitical uncertainty unfolding by the minute, there is a question to be raised as to whether deal volumes will continue to react in such a way,” Deloitte says.
Among other key findings, Deloitte noted that the banks have found a way to fight back for market share lost to private debt through innovative joint ventures. “As a result, they are able to compete head on with private debt funds where previously they may have competed with a lower levered, but more price advantageous solution”.
It’s also true, however, that the banks have a long way to go to win back what they lost. The study reflects that, in the ten years since 2012, the share of non-bank to bank lending has reversed from 20:80 to 80:20. In the space of a decade, that’s quite some transformation.
(Past performance is no guarantee of future results.)



Latest news

US Leveraged Loans Return 3.36% to Investors YTD
The Bloomberg US Leveraged Loan Index (Ticker: LOAN) returned 0.96% in August and has gained an additional 0.28% through September…

PE dry powder
The capital that is being raised is flowing overwhelmingly to the largest, most established managers.

Middle market debt held by BDCs vs High yield vs Treasury yields
The blue line represents the current dividend yield of the VanEck BDC Income ETF (BIZD), which stood at 11.7% as…