


Private Debt Intelligence – 1/6/2025

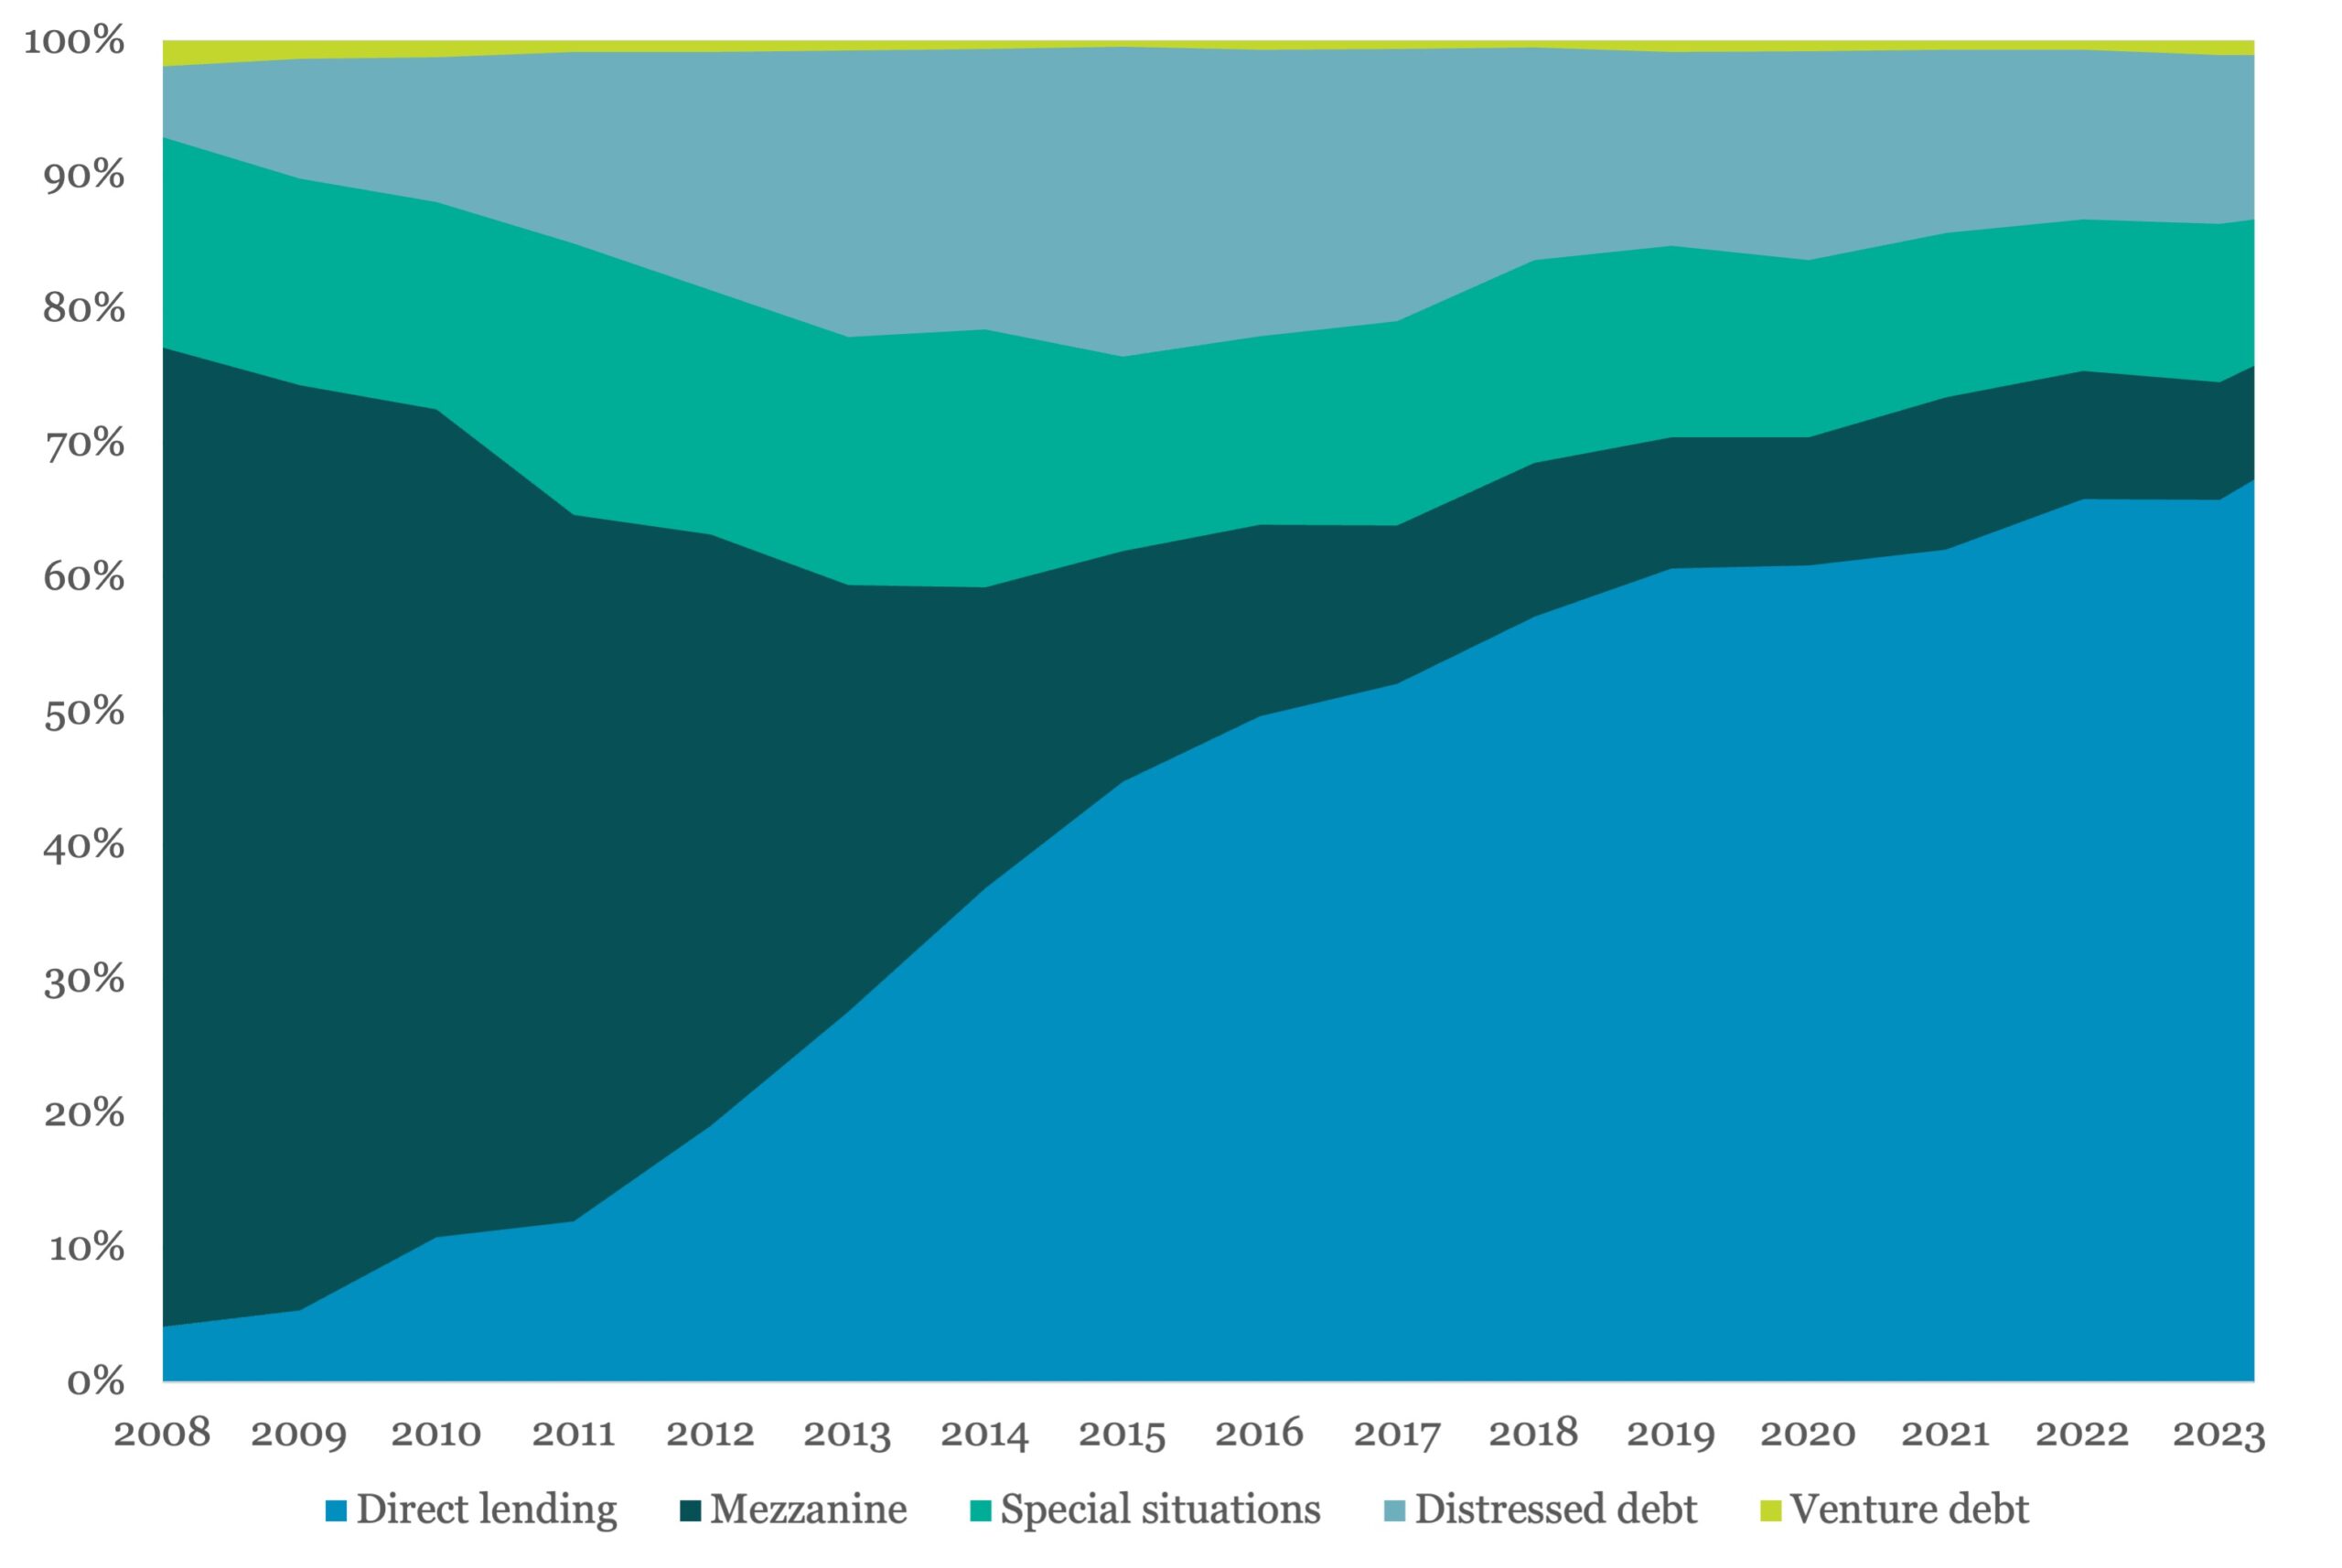
Direct lending the driver of private debt growth in Europe
Chart
Download Data
[wpdm_package id=’73073′]
Read more in Preqin’s ‘2025 Global Report: Private Debt’.
Since the Global Financial Crisis, direct lending AUM has grown at a faster rate than other private debt strategies in Europe, such that it now comprises more than two-thirds of private debt AUM (67.3%). Higher risk and more specialized strategies, such as mezzanine and distressed debt, have declined as a proportion of AUM, with mezzanine falling from 72.0% in 2008 to just 8.5% in 2024. However, AUM in Europe-focused mezzanine funds has increased over that period, from $26.5bn in 2008 to $40.6bn as of March 2024, highlighting how changes in banking regulation since GFC created the opportunity for private debt funds to fill a market gap in Europe.
Contact: William Bennett-Lynch
william.bennett-lynch@preqin.com



Latest news

US Leveraged Loans Return 3.36% to Investors YTD
The Bloomberg US Leveraged Loan Index (Ticker: LOAN) returned 0.96% in August and has gained an additional 0.28% through September…

PE dry powder
The capital that is being raised is flowing overwhelmingly to the largest, most established managers.

Middle market debt held by BDCs vs High yield vs Treasury yields
The blue line represents the current dividend yield of the VanEck BDC Income ETF (BIZD), which stood at 11.7% as…