


Private Debt Intelligence – 11/27/2017

Private Debt Management Fees
Chart
Download Data
[wpdm_package id=’15426′]
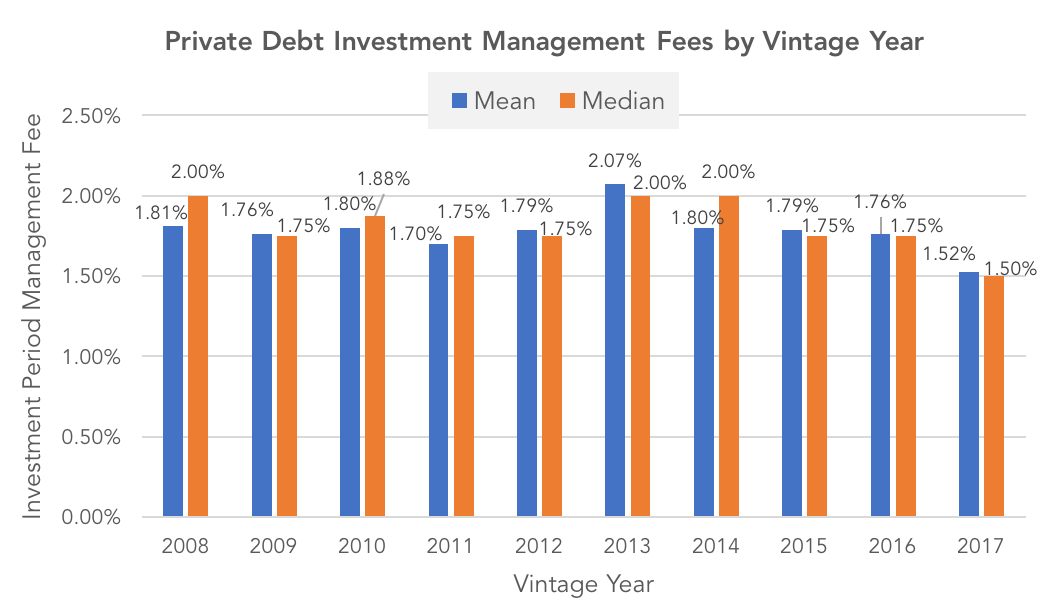
Both mean and median management fees for private debt funds have been moving down since the highs for vintage 2013 funds, with the average management fees falling to a 10-year low among 2017 vintage funds. The mean investment fee for 2017 vehicles has dropped to 1.52%, while the median fee has dropped to 1.50%.
By comparison, for private debt funds with a vintage year of 2016, the mean management fee was 1.76%, and the median fee was 1.75%, while vehicles with a vintage year 2013, had mean management fee of 2.07% and a median of 2.00%. In fact, this is the fourth consecutive year that management fees have stayed flat or fallen.
The drop in average management fees has been driven, in part, due to the proliferation of direct lending vehicles coming to market in recent years, which typically draw lower rates than other, more labour-intensive, fund types. The expansion of the direct lending market has led to has increased competition, driving fund managers to lower their fees to distinguish themselves from their competitors. Direct lending vehicles, on average, are charging the lowest median fee of any debt type of 1.50%, and a mean of 1.57%.
By comparison, venture debt charges the highest fees of any fund type. In fact, in direct contrast to the overall trend of decreasing private debt management fees, from 2016 to 2017, venture debt fees have increased to a mean of 2.30% and a median of 2.50% from 2.17% and 2.00%, respectively. Management fees for other fund types, however, have remained relatively unchanged: distressed debt funds and mezzanine funds charge a median of 1.75%, while special situations charge 2.00%.




Latest news


PE fund distribution rates
Following 2021, buyout distribution rates have fallen to roughly 10% to 15% below the 25-year average.

Sub line pricing flattens
A report on the topic also finds that investors are less concerned by leverage in NAV loans. Pricing for subscription…