


Private Debt Intelligence – 5/28/2018

Private Debt Deals: North America vs. Europe
Chart
Download Data
[wpdm_package id=’18392′]
2017 saw the highest level of fundraising activity for private debt funds to date, a strong indication of increasing investor appetite for the asset class. However, fund managers must now put this capital to work. In a recent Preqin survey, the largest proportion of fund managers cited valuations (49%) and deals flow (37%) as key challenges facing private debt in 2018.
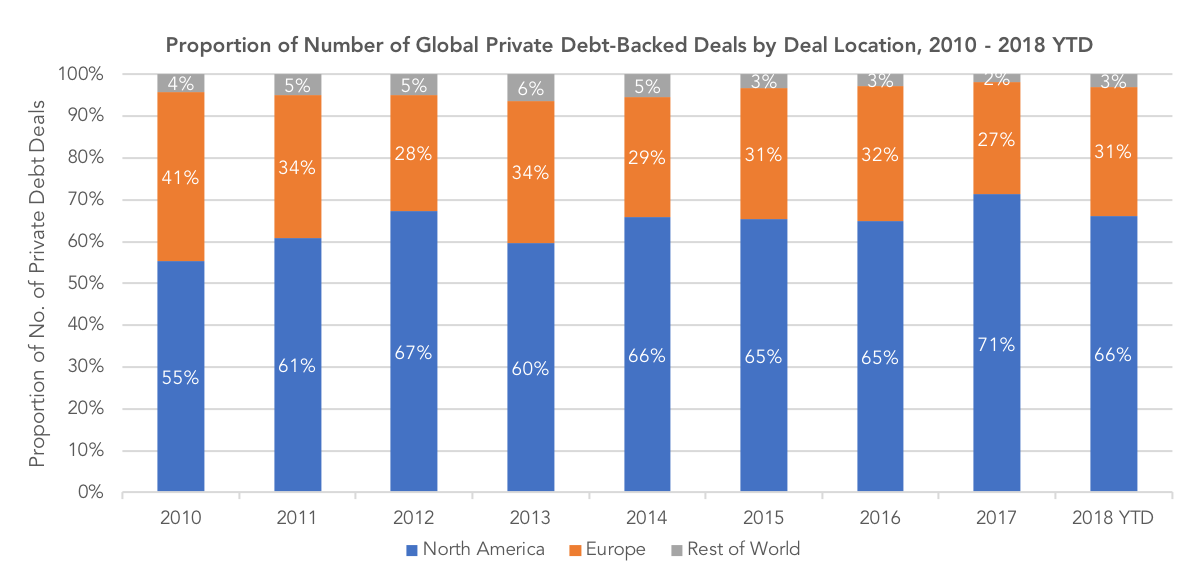
Despite concerns regarding competition and access to high-quality deals, the number of private debt-backed deals based in North America has increased since 2010, reaching its highest point in 2017. The region has accounted for a significant proportion of deal activity in the last decade or so, accounting for 55% of deals completed in 2010, and increasing gradually, but steadily to 71% in 2017. By contrast, Europe has seen a slight decrease in deals completed over the same time period: in 2010, the region accounted for 41% of deals, but made up just 27% of deals in 2017.
Proportions of private debt deal value by region have acted much more erratically in the past few years. In 2010, Europe accounted for 40% of the value of private debt deals, while North America accounted for 58%. Europe then saw a steady and steep decrease in proportion of deal value over the next five years, accounting for a low of 10% in 2015, while in the same year North America deals accounted for 82% of transaction value. Europe then saw its deal value proportion jump back up to 20% in 2016 and then increased again to 35% in 2017. Meanwhile, North America has consistently made up over half of deal value in the private debt market over the past decade.
Deal origination is likely to remain a key concern for fund managers given the high levels of dry powder in Europe and smaller firms at risk being pushed out by larger debt providers in North America. However, the amount of capital entering the market is a positive sign for the asset class, and should encourage managers to think of innovative ways to put investor capital to work.
Contact: Naomi Feliz
naomi.feliz@preqin.com



Latest news

Top 50 BDCs Accounted for 75% of Nonaccrual Loan Cost in Q2’26
The 50 largest BDCs, on the basis of total debt investments as of the second quarter of 2026, accounted for 75% of the total aggregate reported value of nonaccrual debt at cost and fair value.

US private debt AUM ($B) by channel
In 2025 and the early part of 2026, the retail channel added AUM to the asset class at a much faster rate than institutional investors in both regions, with growth rates of 43.7% globally, 41.4% in the US, and 73. 1% in Europe through the beginning of 2026 compared with year-end 2024 figures.
