


Private Debt Intelligence – 6/11/2018

Private Debt and Public Market Performance
Chart
Download Data
[wpdm_package id=’18633′]
A key issue for investors when evaluating the performance of their private debt investments is the correlation to public markets. Part of the appeal of private debt is its low correlation to other asset classes, as well as its long-term and illiquid nature. As such, though, it makes accurately gauging the performance of private debt investments against more liquid asset classes a challenging prospect.
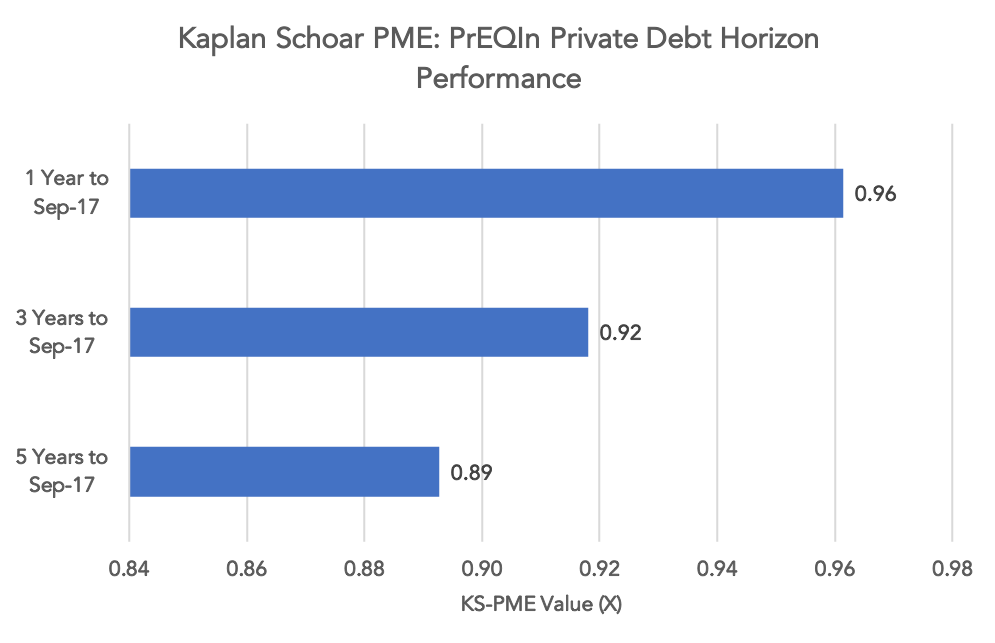
To combat this, there are several different calculations known as Public Market Equivalents (PME), designed to offer an accurate comparative measure of alternative and traditional asset class performance within a given time frame. Preqin tracks the cash flow data of over 400 private debt funds from their inception, enabling it to compile PME metrics for the sector. One such method is the Kaplan Schoar PME, shown here.
Investors may find PME scores more appropriate than comparing the net IRRs of funds within their peer group. In this method, the timing and size of transactions in a real private debt fund are matched with hypothetical investments made into an appropriate public market index. The Kaplan Schoar PME then calculates a ratio between the two streams of investments (actual and theoretical). Values exceeding one illustrate instances in which private debt has outperformed the hypothetical public return.
As shown in the figure above, the private debt asset class has generally underperformed the public market, with all three time periods through to September 2017 falling short of the public market equivalent return. It appears that over shorter time horizons, the private debt industry has come closest to outperforming the public market, which is reflective of the industry’s recent successes and continued development into an established asset class in the alternatives space. However, the onus is on fund managers to show that their vehicles cannot just approach public market performance, but actually exceed it, for private debt to be able to keep up its pace of growth.
Contact: Naomi Feliz
Naomi.Feliz@preqin.com




Latest news
Q2'26 BDC analysis shows additional 184 bps of nonaccruals at cost
In a universe of 173 business development companies, or BDCs, Octus identified a total of $9.5 billion of debt (at cost) in nonaccrual status reported in the second quarter of 2026, a slight decline of 5% from $10 billion in the first quarter of 2026.

Reading the Board
The story changes depending on which numbers you’re counting.
Private Credit Defaults 101: Different Numbers, Different Stories
In Season 2 of Billions, Bobby Axelrod takes his lawyer Orrin Bach to an empty Yonkers racetrack in the dead of night.