


Private Debt Intelligence – 6/24/2019

Europe Private Debt
Chart
Download Data
[wpdm_package id=’26156′]
Over the past ten years, private debt fundraising has grown from $23bn in 2009 to $118bn in 2018. A big proportion of this expansion can be attributed to Europe. Eighty-seven percent of private debt investors believe Western Europe presents the best opportunities in private debt, from which 34% is attributed to the UK, according to the Preqin H1 2019 Investor Outlook report.
Over the last five years, Europe-focused fundraising has seen peaks and troughs, but has not raised less than $26bn every year. Peaks in 2015 and 2017 have been followed by slumps in 2016 and 2018. Nevertheless, the overall trend is towards growth, and even in the lackluster fundraising environment of 2019, Europe-focused funds have already raised almost $20bn in the first half of the year.
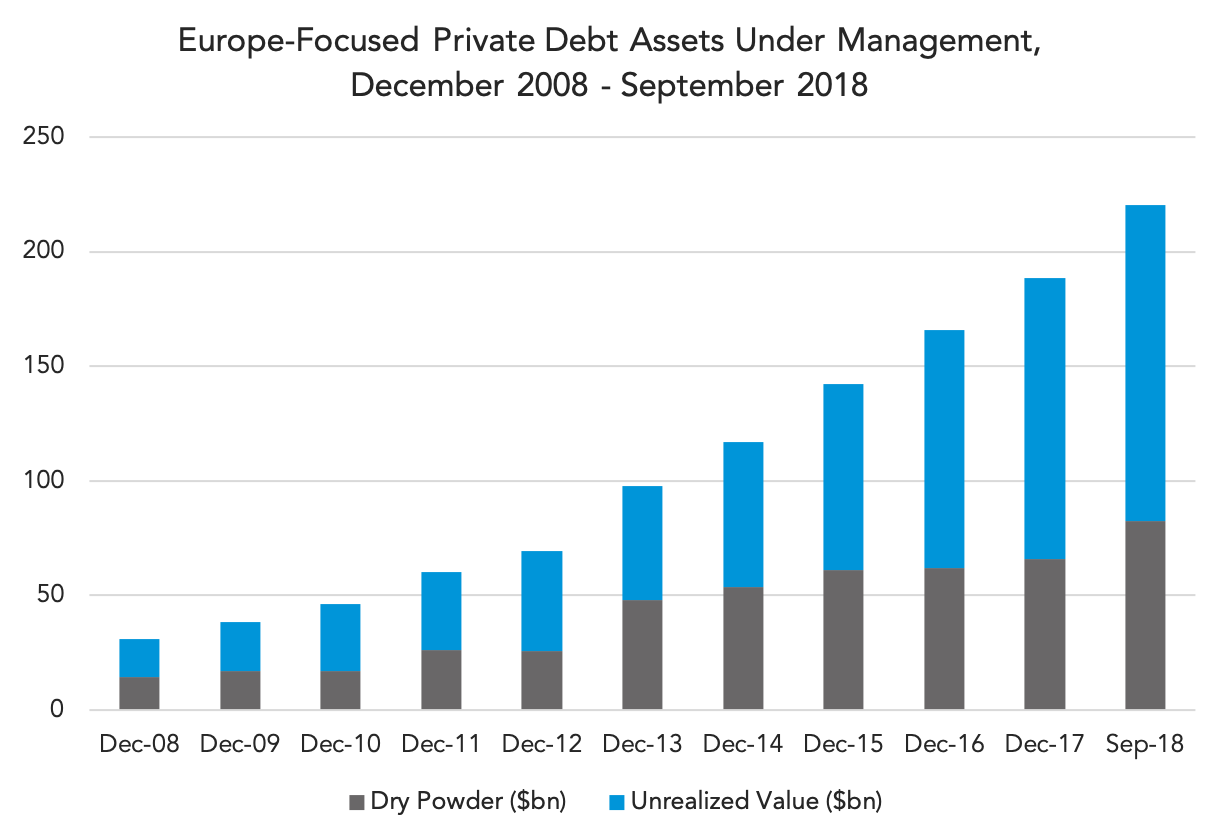
Despite its ups and downs in fundraising, Europe-focused private debt market has been unceasingly growing for the last 10 years. The sector accounted for just $31bn in assets in December 2008, but by September 2018 fund managers held $220bn, of which $83bn is dry powder. The market is almost seven times bigger than it was ten years ago.
The strategies most used by fund managers targeting Europe are direct lending and distressed debt, mirroring global trends. The assets in these fund types are $87bn and $47bn respectively. The least used strategy appears to be venture debt, having just $1.3bn in assets.
Although 2019 Europe-focused private debt fundraising seems to be going slowly, this year’s capital secured has overpassed the figures seen the same period last year and has taken advantage over North America-focused private debt.
Contact: William Clarke
william.clarke@preqin.com



Latest news

US Leveraged Loans Return 3.36% to Investors YTD
The Bloomberg US Leveraged Loan Index (Ticker: LOAN) returned 0.96% in August and has gained an additional 0.28% through September…

PE dry powder
The capital that is being raised is flowing overwhelmingly to the largest, most established managers.

Middle market debt held by BDCs vs High yield vs Treasury yields
The blue line represents the current dividend yield of the VanEck BDC Income ETF (BIZD), which stood at 11.7% as…