


Private Debt Intelligence – 7/3/2017

Public Pension Funds in Private Debt
Chart
Download Data
[wpdm_package id=’13245′]
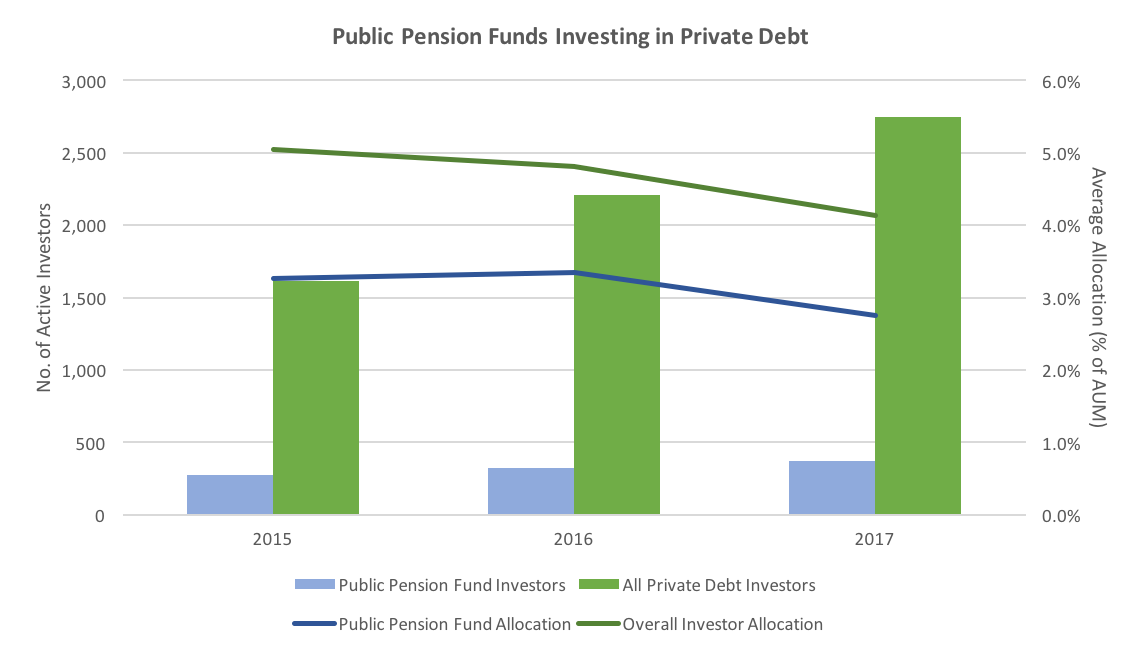
Public pension funds are among the most important institutional investors active in the private debt asset class. They comprise some of the largest and most influential limited partners, committing large amounts of capital and often providing a model for other institutions. The growth of the private debt industry has been mirrored by the increasing number of public pensions investing in the asset class, but it seems that at the same time, these investors are allocating smaller proportions of their assets to making private debt investments.
Preqin began tracking closed-end private debt investments as a discrete allocation preference in 2015. At that time, it tracked 275 public pension funds globally which are actively investing in the asset class. This has risen consistently year-on-year, to 322 in 2016 and 371 in 2017. This is broadly in line with the total private debt investor universe: the overall number of investors rose from 1,613 in 2015 to 2,210 in 2016 and 2,749 in 2017. This consistent level of growth is an encouraging sign for the industry, but it has resulted in public pensions representing a diminishing proportion of the total number of investors, from 17% in 2015 to 13% today.
However, at the same time the average allocation of public pension funds to private debt is also decreasing. The average proportion of assets being allocated to the industry by public pensions has fallen from 3.26% in 2015 to 2.76% in 2017. This mirrors the allocation patterns seen among the investor population as a whole: average allocations have fallen from 5.04% to 4.13% in the same period.
This could be due to larger institutions entering the asset class: those with the largest AUM may be allocating a small proportion to private debt, and still be making significant commitments. However, it may also indicate that allocations are not increasing among pre-existing investors in order to offset low allocations from new entrants. If so, this would reflect a break in historical allocation patterns seen in other asset classes in recent years. The current growth of private debt investors seems set to continue in the coming months, but if average allocation levels continue to fall, it may ultimately hamper the expansion of the industry.



Latest news

European mid-market direct lending margins face steady compression since 2024
European mid-market direct lending margins have seen consistent compression over recent years but recorded a slight increase in the second quarter of 2026…

US leveraged loan issuance rebounds in September
Following three consecutive months of declining issuance, the US leveraged loan market has reversed course in September. Approximately $48.7b of…

Reversion to the Mean
Climbing toward the average is a very different story than surpassing it.