



Add-ons retain commanding share of US buyout activity
At 64% of all US buyout activity through the end of September, add-ons have never before constituted such a lofty proportion of private equity investing. Part of that is a statistical quirk—as the volume of buyouts has slid while investors by and large maintained the pace of adding on, their relative proportion was bound to increase. But as has been noted time and again over the past couple years as the add-on percentage of US buyouts crept over 60%, the primary drivers of add-ons have been a consistently competitive dealmaking environment, a shrinking supply of quality opportunities for original platform buys and relatively costly transaction multiples, which last is attributable in no small part to the aforementioned trends.
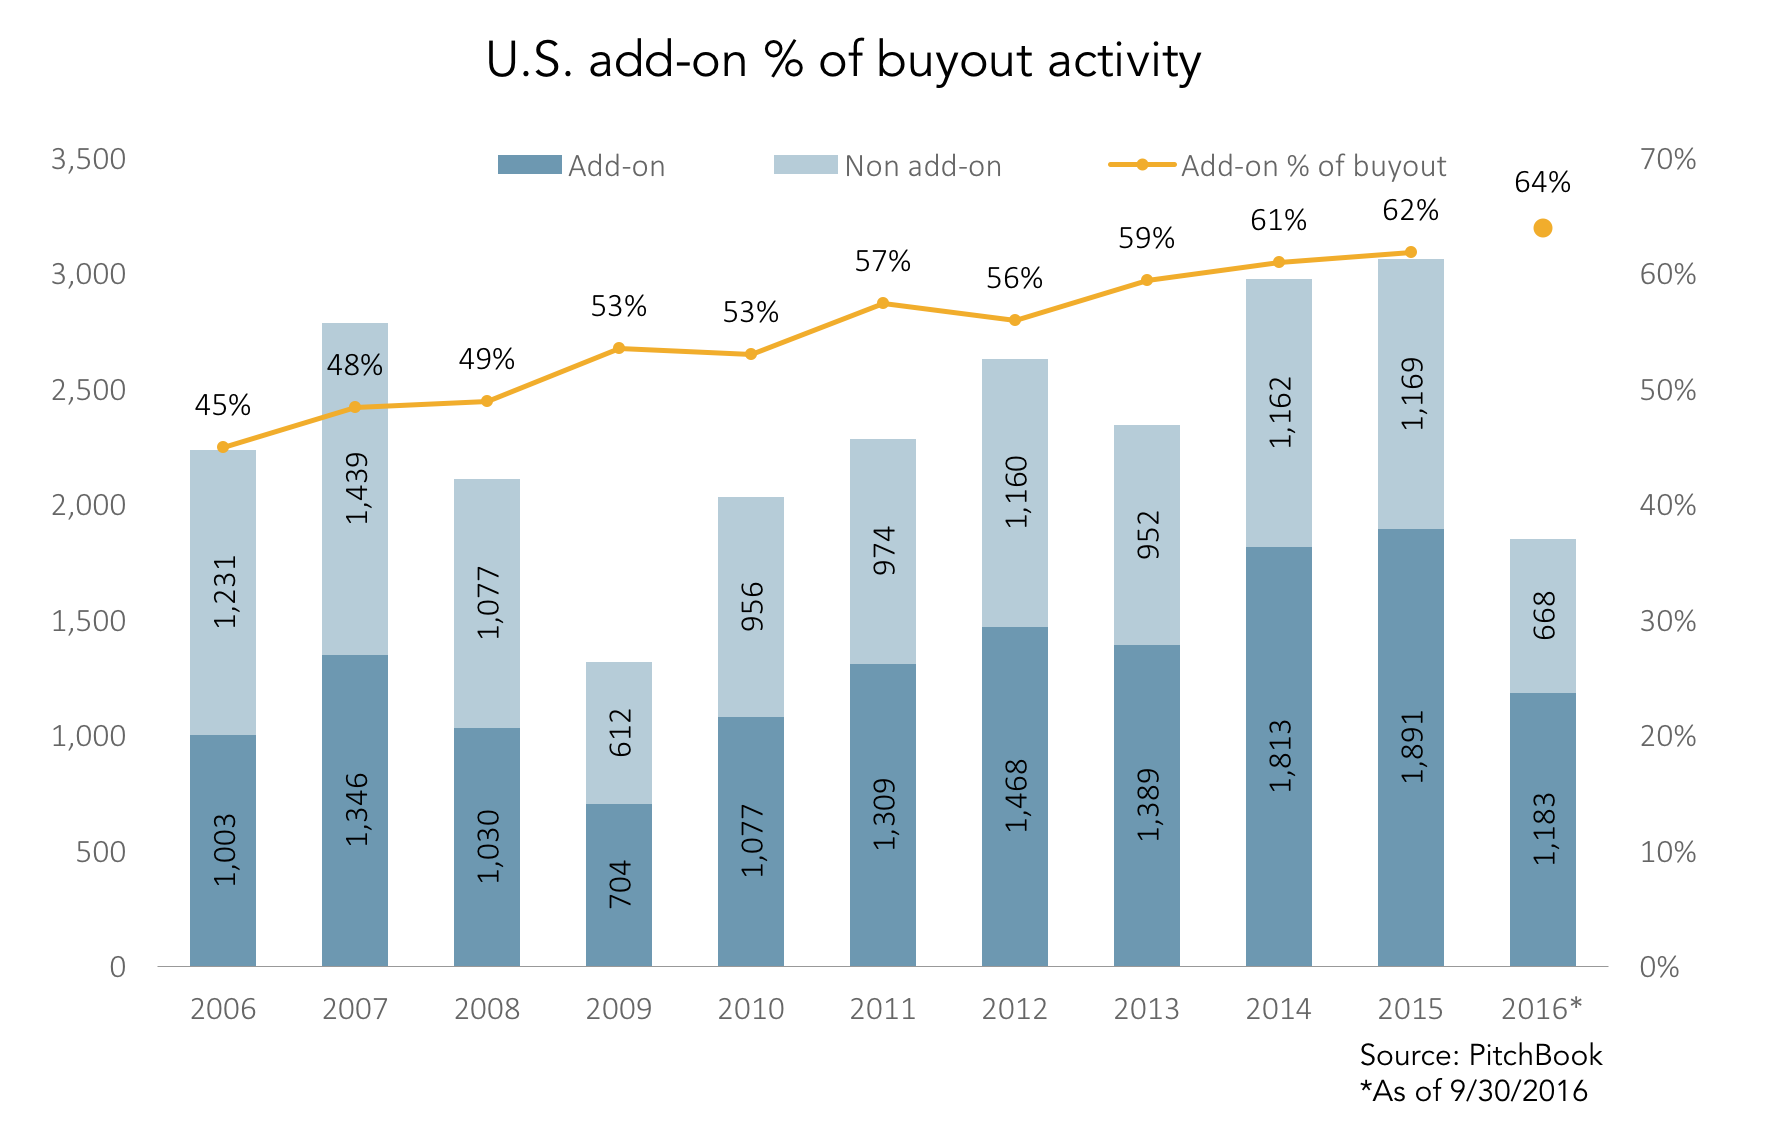
It’s difficult to gauge how much longer this confluence of factors may persist. For one, economic growth could finally bump upwards significantly if there is a sizable shift in fiscal policy, which, in the wake of the US presidential election, could well occur. That could embolden PE investors to make riskier plays predicated on at least a short period of stronger growth. But at the same time, the quality of platform opportunities within the market isn’t simply going to surge over the next few quarters and reverse the trend toward add-ons. Within the lower middle market, aging baby boomers looking to sell and retire may contribute to a relatively steady stream of companies being put up for sale, but that’s just one of the few positive factors when it comes to the supply of businesses being brought to market. Sector-specific drivers could help as well—e.g. the level of fragmentation in healthcare services or segments prone to consolidation as efficiencies of scale trump organic growth opportunities—but in general, the level of adding on looks set to continue for the foreseeable future, with only one potentially detracting factor. For in-demand platform extensions, multiples have been climbing, which could eventually depress even the prevalence of adding on and further slow the overall buyout cycle.
☞ Read PitchBook’s 3Q 2016 US PE Breakdown Report here.
Contact: Garrett Black
garrett.black@pitchbook.com




Latest news


PE fund distribution rates
Following 2021, buyout distribution rates have fallen to roughly 10% to 15% below the 25-year average.

Sub line pricing flattens
A report on the topic also finds that investors are less concerned by leverage in NAV loans. Pricing for subscription…