



As Investment Activity Slows, Competition for Quality Remains Fierce
As March winds down, the first quarter of 2016 currently has seen around 700 private equity deals close in the U.S. Taking the total as 700, that completed deal count represents a drop of nearly 29% from the tally of 4Q 2015, which itself saw the slowest deal flow in several quarters. Although overall deal value remains fairly strong on a historical basis, it’s clear U.S. PE investment is experiencing a downturn.
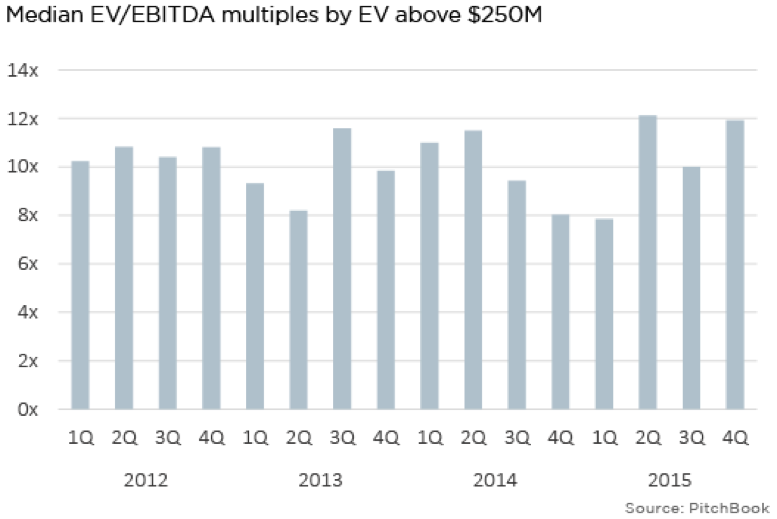 Yet, even in a slowing 4Q 2015, median EV/EBITDA multiples for companies with enterprise values exceeding $250 million remained on the higher end, closing in on 12x. Taken in conjunction with the diminishing level of activity, that may well be the result of only quality deals closing in an uncertain environment. At the same time, it reflects the current dealmaking landscape: PE firms are flush with capital and able to secure financing for certain prospects, thus enabling high bids, even as they shy away from the level of activity seen previously. The fact multiples are particularly high for companies with EVs greater than $250 million also testifies to the level of competition within that playing field, with PE investors and strategic acquirers vying against each other. The question is whether these multiples will sustain at an elevated level, once final numbers for 1Q 2016 come in. With a more dramatic drop in completed deals, the hunt for quality opportunities has only intensified, if anything, and thus what deals have closed likely have been for similarly sizable sums, given the healthy level of total deal value. Talk of disconnects between the expectations of sellers and buyers continue, with buyers increasingly reluctant to pay the prices seen through much of 2015, although the majority seems to veer more toward the opinion it is still a seller’s market. Consequently, subdued activity seems likeliest going forward, with buyers still paying high multiples when justifiable, perhaps reverting back to medians between 10x and 11x, as opposed to what was seen at the end of 2015.





Latest news

PE exit activity
Exit value fell to $102.6 billion in the second quarter—down 46.3% from the prior quarter and 7.4% YoY—while exit count dropped to 353, a 14.1% quarterly decline and a 5.4% rise against Q2 2025.

US BSL and MM CLO Performance Held Stable in July 2026
In July 2026, portfolio credit quality in reinvesting Fitch-rated U.S. BSL CLOs remained broadly stable from June. Net portfolio losses held at 0.5%. The Fitch weighted average rating factor also held at 23.1. The Fitch weighted average recovery rate declined slightly by 0.1%, while the weighted average spread fell by 0.01%.
