



Download PitchBook’s Report click here.
The run-up in public market valuations and its impact on PE has been discussed ad nauseum. Much of that impact has been negative, especially around multiples and a lack of suitable entry prices. PE’s strong suit has historically been the turnaround play—buy low, get your hands dirty, improve operations, sell high. Bull markets hinder that, especially when mediocre companies fetch valuations that don’t comport to reality. Many would argue that’s the case today. PE certainly does.
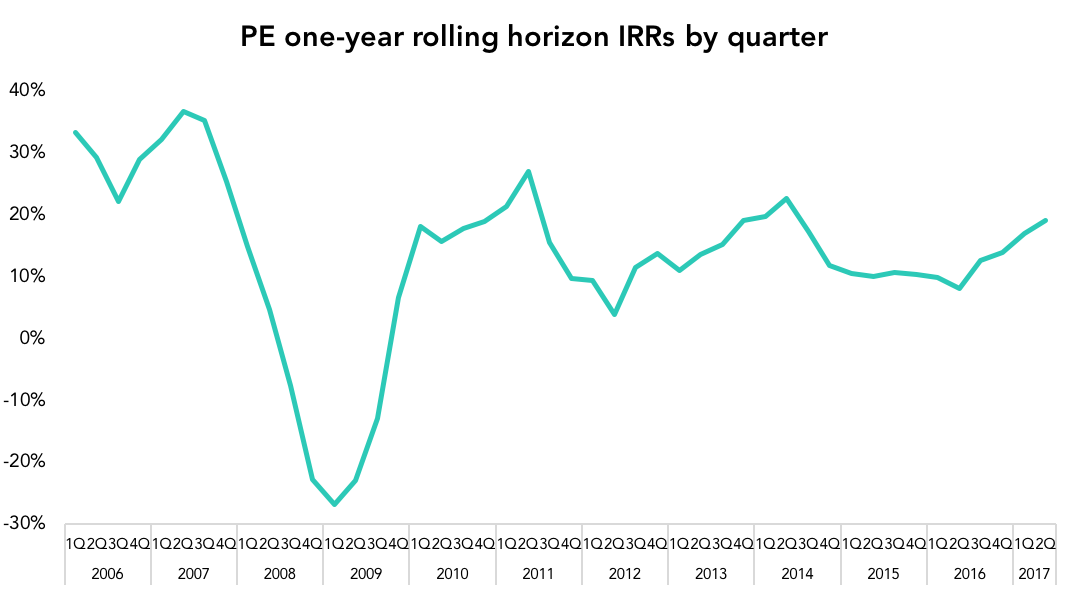
But there’s a flip side to strong public markets, and it’s beginning to show up in PE performance numbers. Our latest PE analyst note highlights the positive effects the bull market has had on returns, which shouldn’t be overlooked. Rolling one-year horizon IRRs rose for a fourth straight quarter in 2Q 2017, the most recent quarter for which data is available. That reflects the impact of the historically strong sellers’ market that continued through 2016. PEGs have enjoyed the luxuries that come with cash-rich strategics with inflated stock prices, which have allowed sellers to exit at high markups and juice their paper gains in existing portfolio companies. Driven by mark-to-market NAVs at the portfolio company level, PE one-year horizons hit 19.1% in 2Q 2017, much higher than other private asset classes. For context, secondaries came in a distant second at 14.2%. In fact, PE one-year horizons have bested their peers all the way back to 1Q 2016, a notable run considering the dynamism of the private market. We don’t expect those figures to remain elevated indefinitely, given the softening exit market and the last innings of a historically long business cycle.
Looking forward, assuming valuations remain high in the near-term, we expect to hear more discussions around an aging inventory. Two cross-winds—PE’s mounting inventory being marked-to-market with inflated public market values—have caused RVPI values (which measure unrealized returns as a proportion of total paid-in contributions) to remain visibly higher than normal. As exit activity subsides and net cashflows dwindle, the industry will have to pay more attention to those remaining investments and work to make their investors whole.
Contact: Alex Lykken
alex.lykken@pitchbook.com



Latest news

US Leveraged Loans Return 3.36% to Investors YTD
The Bloomberg US Leveraged Loan Index (Ticker: LOAN) returned 0.96% in August and has gained an additional 0.28% through September…

PE dry powder
The capital that is being raised is flowing overwhelmingly to the largest, most established managers.

Middle market debt held by BDCs vs High yield vs Treasury yields
The blue line represents the current dividend yield of the VanEck BDC Income ETF (BIZD), which stood at 11.7% as…